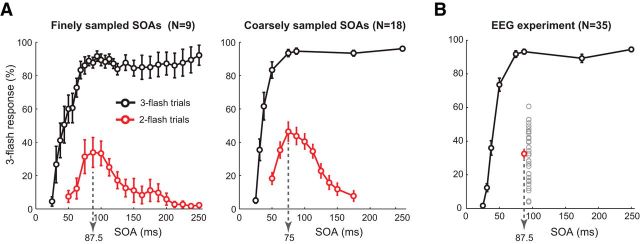
Figure 2.
Behavioral performance. Percentage of three-flash percepts for two- and three-flash trials as a function of SOA between veridical flashes. A, Behavioral results of psychophysics Experiment 1, where fine (17 SOAs for two- and 27 SOAs for three-flash trials) and coarse (10 SOAs for the two- and 8 SOAs for the three-flash trials) were used. Dotted arrows indicate two-flash trial SOA that produced on average the maximum number of illusions. B, Behavioral results of the EEG experiment (Experiment 2), where the two-flash trial SOA was fixed at 87.5 ms. Gray circles represent average percentage of illusions for each participant (N = 35). Error bars indicate SEM.

