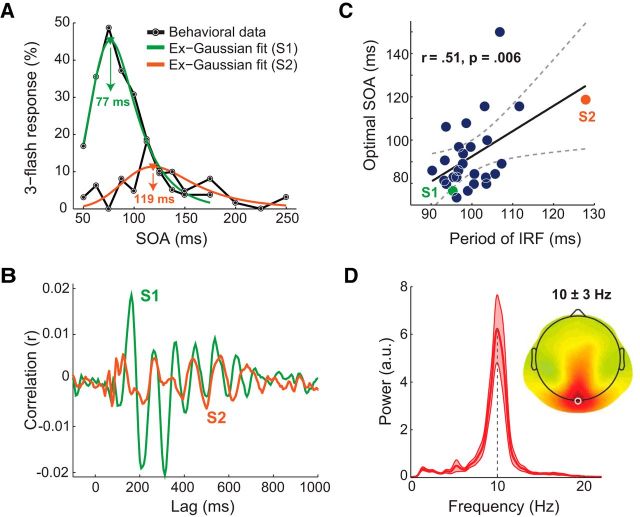
Figure 3.
Relationship between period of IRF and optimal delay between flashes. A, Behavioral data from 2 participants (S1 and S2) showing the probability of third-flash perception on two-flash trials as a function of SOA (black lines), and ex-Gaussian fits used to determine subject-specific optimal SOA (green and orange lines). B, Single-subject IRFs at Oz electrode (same participants as in A). C, Correlation (across participants, N = 27) between period of IRF at Oz electrode and optimal SOA. Dashed curves indicate 95% CIs around the slope of regression line. Green and orange dots represent participants' data depicted in A, B. D, Subject-average power spectrum of IRF at Oz and topographical map of 10 ± 3 Hz power, indicating that IRF is strongest around Oz (white circle). Subject-average power spectrum of IRF at Oz electrode with a peak centered at 10 Hz. Light red areas represent SEM.

