Figure 4.
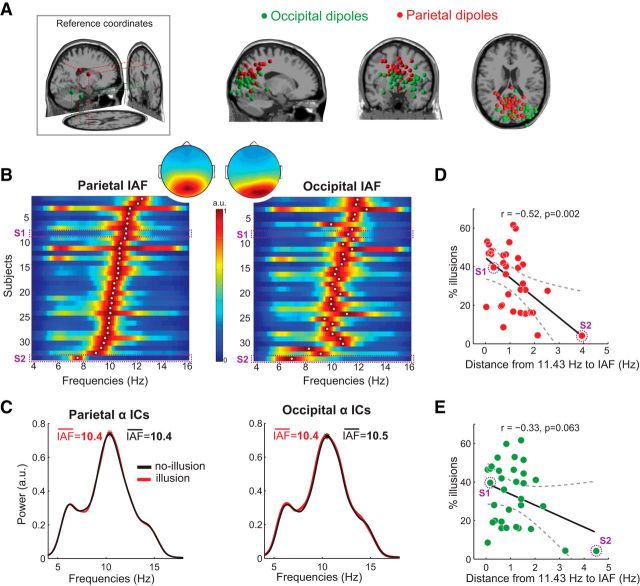
Relationship between the frequency of alpha oscillations and third-flash illusory percepts. A, Dipole locations for anatomical reference coordinates for parietal and occipital ROIs (leftmost panel). Locations of equivalent dipoles for parietal and occipital alpha ICs. B, Power spectra of alpha parietal and occipital IC time series in the prestimulus window (−1000 to 0 ms, where 0 is the first flash), normalized to the power of each participant's alpha peak (for comparability across participants). Each row represents a participant. Color represents normalized spectral power. White dot represents the individual's alpha peak frequency. Dashed rectangles represent the power spectra of exemplar Subjects S1 and S2 depicted in Figure 3A, B. Inset, Topographical maps represent scalp projections of parietal and occipital equivalent dipole centroids, revealing more central and anterior projection for parietal ICs. C, Subject-average normalized power spectra of occipital and parietal IC time series in the prestimulus window, illustrating that IAF defined from all versus separate classes of trials did not differ. D, E, Correlations (across participants, N = 33) between IAF and overall percentage of illusions, indicating that the proportion of illusions depended more strongly on the match between interflash delay (11.43 Hz ∼ 87.5 ms) and IAF at parietal (D) than occipital alpha sources (E).

