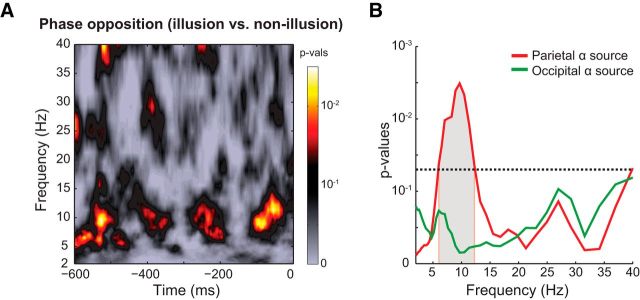
Figure 5.
Prestimulus alpha phase differences between illusion and nonillusion trials. A, Time-frequency representation of p values (for parietal alpha sources) computed as a proportion of surrogate phase opposition values (distribution of phase opposition values expected under null hypothesis) that exceeded empirically observed phase opposition values. B, Frequency profile of phase opposition (averaged over −600 to 0 ms prestimulus time window). Gray shaded area represents frequencies at which the observed phase opposition frequency profile was significantly different from the frequency profile of surrogate phase opposition values (corrected for multiple comparisons across frequencies using cluster-based permutation testing). Horizontal line indicates p = 0.05.

