Figure 1.
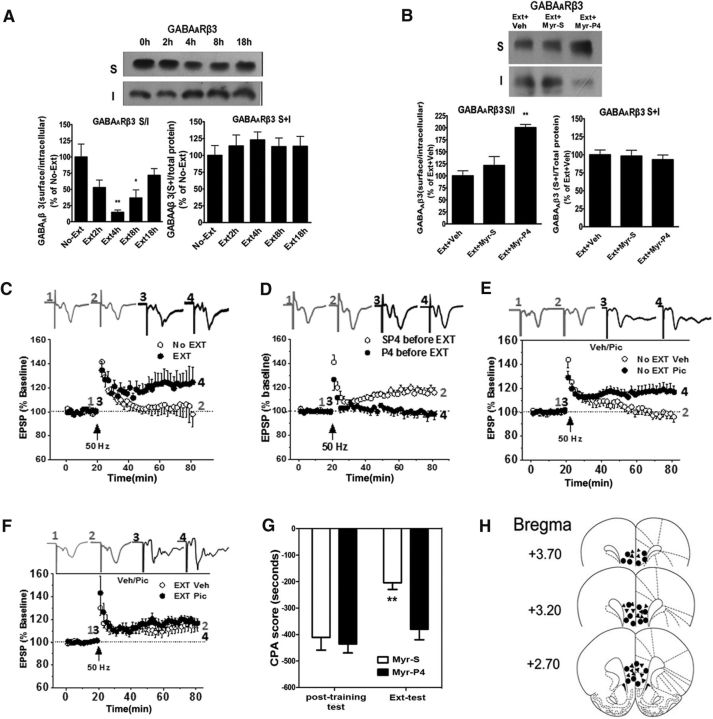
Extinction training results in LTP induction and CPA extinction by dynamin-dependent GABAAR endocytosis. A, Extinction training resulted in endocytosis of GABAAR β3 subunits (Fig. 1-1). B, Endocytosis of GABAAR β3 subunits was prevented by bilateral infusion of dynamin function-blocking peptide (Myr-P4, 30 pmol/0.5 μl/side) but not scramble inactive peptide (Myr-S) into the vmPFC 60 min before extinction training (Fig. 1-2). C, The 50 Hz stimulus induced reliable LTP in slices from rats that underwent extinction training but not in those that did not undergo extinction training. D, HFS at 50 Hz failed to induce LTP in slices from rats that were pretreated with bilateral infusion of Myr-P4 (30 pmol/0.5 μl/side) into the vmPFC 60 min before extinction training, but it normally induced reliable LTP in slices from rats that were pretreated with Myr-S before extinction training. E, In the presence of GABAAR blocker picrotocxin (100 μm), HFS at 50 Hz was able to elicit LTP induction in slices from rats that did not undergo extinction training. F, The same picrotoxin application did not induce significant change in the facilitated LTP induction found in slices from rats that underwent extinction training. G, CPA extinction was impaired by intra-vmPFC infusions of Myr-P4 (30 pmol/0.5 μl/side) but not Myr-S before extinction training. H, Schematic representation of injection sites in the vmPFC for rats used in the experiments. A, B, Top, Representative blots of surface (S) and internalized (I) GABAAR β3 subunits from the vmPFC tissues of rats prepared at different time points after extinction training (A: 2, 4, 8, and 18 h) or (B: 4 h). Bottom, Quantification of the S/I ratio of GABAAR β3 subunit levels from Western blot data. Error bars indicate mean ± SEM (n = 6–8). *p < 0.05, compared with the no-extinction control or vehicle control groups (one-way or two-way ANOVA followed by Bonferroni's post hoc test). **p < 0.01, compared with the no-extinction control or vehicle control groups (one-way or two-way ANOVA followed by Bonferroni's post hoc test). The magnitude of LTP was the average of the last 5 min recordings expressed as the mean ± SEM percentage of the baseline fEPSP. Data were analyzed with two-tailed Student's t tests.

