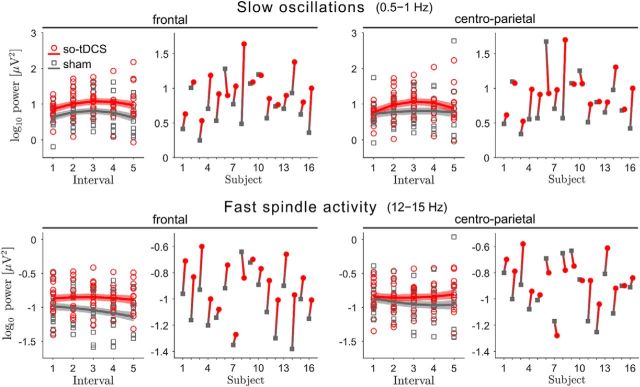
Figure 2.
so-tDCS enhances EEG power in the SO and fast spindle frequency ranges. EEG power in the SO (0.5–1 Hz, top) and fast spindle (12–15 Hz, bottom) frequency ranges for the five 1 min stimulation-free intervals, for so-tDCS (red) and sham (gray) condition, and considering the frontal (left) and centroparietal (right) ROI. Mean estimates ± SEM (shaded regions) from the LMM are included. To the right, individual mean power changes (mean over all intervals for each subject) from sham (gray squares) to so-tDCS (red circles) are indicated for each frequency band and ROI.

