Figure 4.

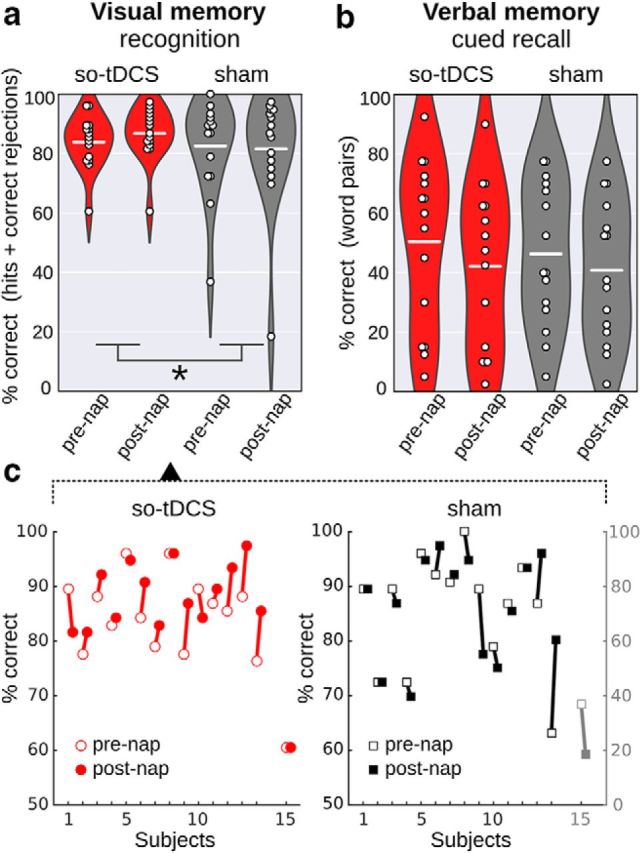
Retention performance in declarative memory tasks in the so-tDCS versus sham condition. a, b, Recognition performance (percentage correct: proportion of hits and correct rejections) in the picture memory subtask (a) and cued recall performance (percentage correct) in the verbal memory task (b) for so-tDCS (red) and sham condition (gray) measured before (pre-nap) and after (post-nap) the nap. Dots indicate individual performances, a white line represents the mean per condition and time point, violin plots show the distributions across subjects. A significant stimulation effect emerged for picture memory, with higher picture recognition performance after so-tDCS compared with sham condition. *p < 0.05. c, Picture recognition performance of individuals before and after napping for so-tDCS (left) and sham (right) condition. Note the separate scale for the outlier (subject 15, gray) in sham.
