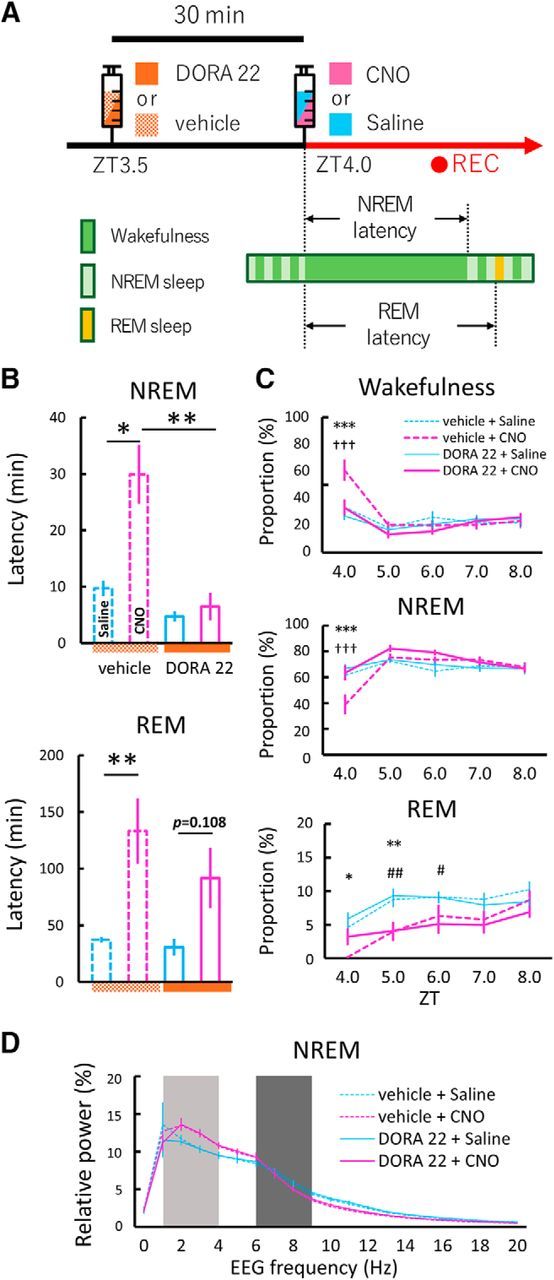
Figure 5.

Dual orexin receptor antagonist (DORA-22) attenuated arousal effects induced by chemogenetic activation of GABABNST neurons. A, Schematic drawing of experimental procedures. Vehicle (20% vitamin E TPGS) or DORA-22 (30 mg/kg in 20% vitamin E TPGS) was administered orally 30 min before the start of EEG/EMG recording. Saline or CNO (5.0 mg/kg) was administered intraperitoneally and mice were subjected to EEG/EMG recording starting at ZT4.0. B, Latency to first NREM (top) or REM (bottom) sleep after saline (blue bar) or CNO (magenta bar) administration. Vehicle + saline, n = 9; vehicle + CNO, n = 9; DORA-22 + saline, n = 9; DORA-22 + CNO, n = 9; *p < 0.05, **p < 0.01, one-way repeated-measures ANOVA followed by Tukey's post hoc test. Values are mean ± SEM. C, Time of each state (top, wakefulness; middle, NREM sleep; bottom, REM sleep) between ZT4.0 and ZT8.0 after saline (blue line) or CNO (magenta line) administration with drugs. Dashed lines and solid lines represent vehicle and DORA-22 groups, respectively. Vehicle + saline, n = 9; vehicle + CNO, n = 9; DORA-22 + saline, n = 9; DORA-22 + CNO, n = 9; *p < 0.05, **p < 0.01, ***p < 0.001, vehicle + saline versus vehicle + CNO; †††p < 0.001, vehicle + CNO versus DORA-22 + CNO; #p < 0.05, ##p < 0.01, DORA-22 + saline versus DORA-22 + CNO; two-way repeated-measures ANOVA followed by Tukey's post hoc test. Values are mean ± SEM. D, EEG power density shown as the mean percentage of total EEG power ± SEM in each group for 2 h after injection for 1 Hz frequency bins between 0 and 20 Hz. The delta (1–4 Hz, light dark) and theta (6–9 Hz, dark) ranges are indicated by shaded areas. No statistically significant differences were observed between groups (n = 9, F(3,24) = 0.46, p = 0.71, two-way repeated-measures ANOVA).
