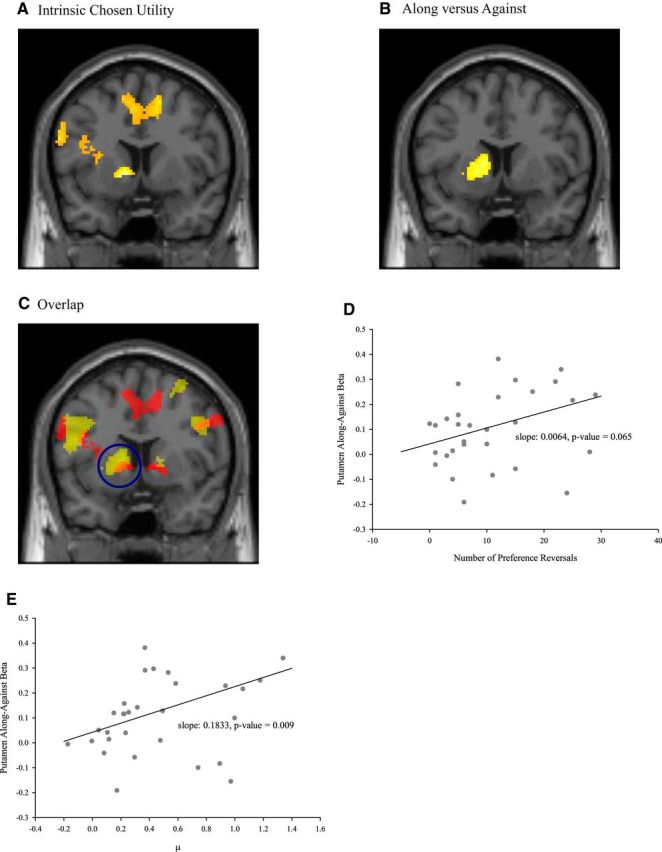
Figure 2.

A, The left striatum (shown at y = 8) correlated parametrically with the intrinsic utility of the chosen option positively (p < 0.05 at whole-brain cluster correction). B, The left striatum was more active in Along than in Against trials (shown at y = 8) (p < 0.05 at whole-brain cluster correction). C, Overlap. The left striatum was more active in Along than in Against trials (shown at y = 8) (shown in yellow at p < 0.001, uncorrected) and correlated parametrically with the intrinsic utility of the chosen option positively (shown in red at p < 0.001, uncorrected). The cluster of the left striatum is circled. Orange represents the overlapping area. D, Positive correlation between the number of preference reversals and the differential striatal Along versus Against activity. The robust regression slope is 0.0064; p = 0.065 (two-tailed). The putamen activity is based on a 4 mm sphere centered at (−20, 12, 2). E, Positive correlation between the average strength of the decoy effect μ and the differential striatal Along versus Against activity. The robust regression slope is 0.1833; p = 0.009 (two-tailed). The putamen activity is based on a 4 mm sphere centered at (−20, 12, 2).
