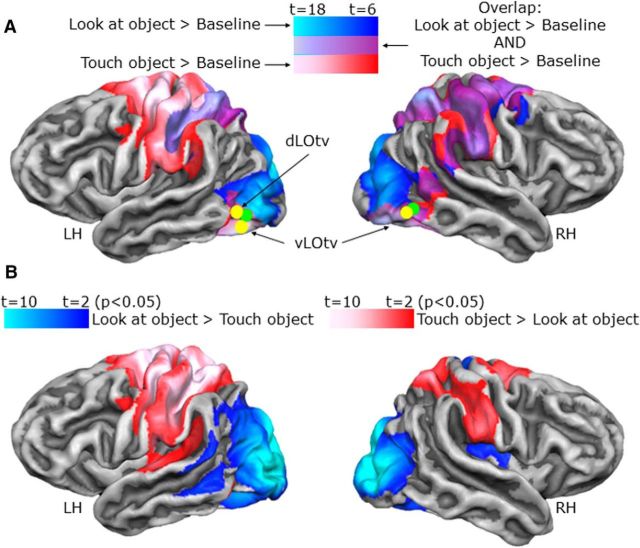
Figure 3.
Activation maps in occipitotemporal and early visual cortices. Voxelwise statistical maps obtained with the separate subject GLM of the LOtv localizer runs. Although issues with anatomical homogeneity on the 4 T scanner made cortex-based alignment too painstaking to conduct, the volumetric activation maps for group ROI results are overlaid on the average cortical surface derived from the cortex-based alignment performed on 12 participants from a different experiment on a Siemens 3 T TIM Trio scanner. The surface from the average of 12 subjects has the advantage of showing less bias in the anatomy of the major sulci compared with the surface of one participant only. We verified that activation from volumetric maps appeared on the corresponding part of the cortical surface. A, The maps show brain areas that respond to visual (blue), haptic (red), and the conjunction of visual and haptic (violet) exploration of objects. The yellow dots indicate the Talairach coordinates of LOtv found in the present study. The green dots indicate the averaged Talairach coordinates of LOtv from previous studies on this area (Tal and Amedi, 2009; Amedi et al., 2010, 2007, 2002, 2001). B, Maps showing brain areas with higher activation for visual than haptic exploration of objects (blue) and areas with higher activation for haptic than visual exploration of objects (red).

