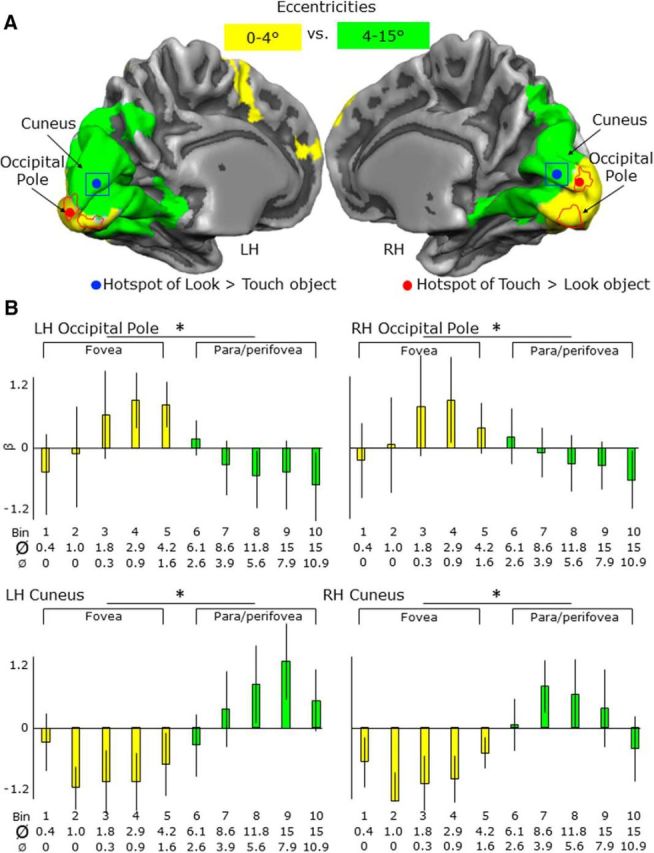
Figure 8.

Activation levels and maps for eccentricities from 0–15° of visual angles in the OP and cuneus. A, Overlap between two activation maps showing areas with higher activation for eccentricities 0–4° than 4–15° (yellow) and areas with higher activation for 4–15° than 0–4° (green). B, For each area, bar graphs indicate the β weights for the eccentricities corresponding to the fovea (0–4°) and para/perifovea fovea (4–15°). Legend is the same as in Figure 4. Ø, Maximum diameter of the ring; Ø, minimum diameter of the ring; bin, time bins used for the eccentricity mapping.
