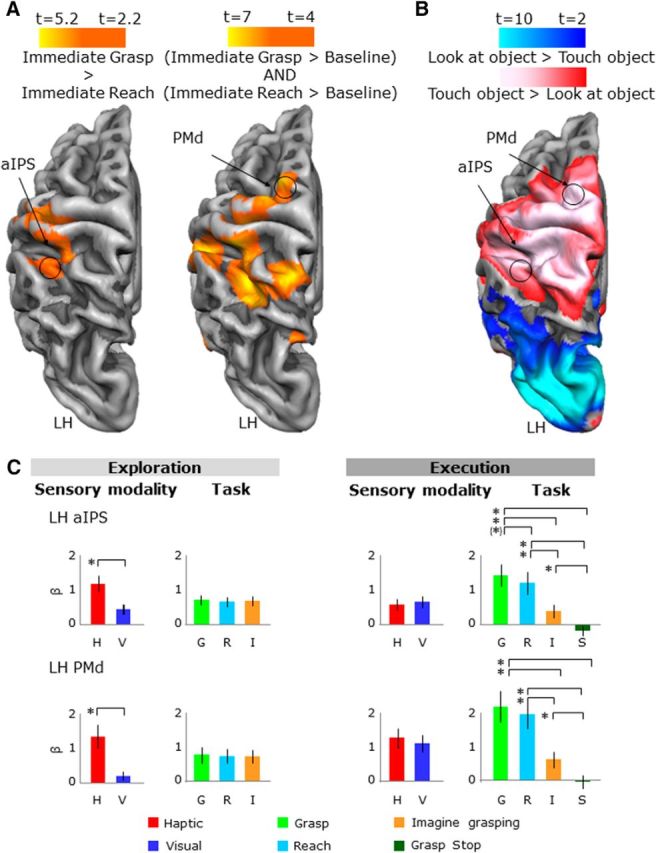
Figure 9.

Activation maps and activation levels in the frontoparietal cortex. Voxelwise statistical maps were obtained with the random-effects GLM of the aIPS functional localizer runs. The activation maps for group ROI results are overlaid on the average cortical surface. A, Left, aIPS localized with a contrast of immediate grasp > immediate reach. Right, PMd localized with the conjunction of (immediate grasp > baseline) AND (immediate reach > baseline). B, aIPS and PMd shown on the activation maps obtained with the LOtv functional localizer runs. The voxelwise statistical maps are the same as in Figure 3. C, β weights plotted the same as in Figure 4. Legend is the same as in Figure 4.
