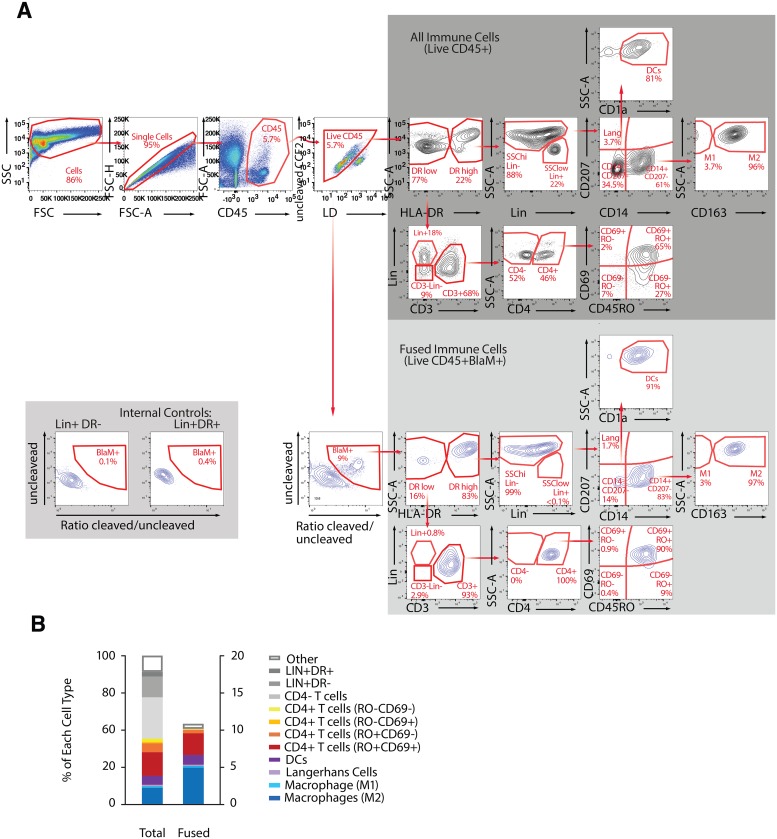
Fig 1. Fusion assay combined with immunostaining to identify and quantify phenotypes of immune cells from endometrium that support HIV-1 fusion.
(A) Gating strategy: The first 4 multicolor FACS plots allow the identification of the “Live CD45+”, which represent the total number of immune present in the endometrial sample. From the “Live CD45+” gate, the “BlaM+ cells” can be identified and represent the immune cells that supported NL-109F4 viral fusion. The FACS plots on the gray background show the gating strategy to identify 11 cellular subsets among the “all immune cells” (dark gray) and among “fused immune cells” (light gray). Note that LIN+DR- or LIN+DR+ can be used as internal control for gating the fused cells (bottom left inset). (B) For an endometrial biopsy sample from a single participant, paired bar graphs show the distribution of immune cell phenotypes (left) and prevalence of fusion susceptibility by phenotype (right). In this sample our immunophenotyping panel recognized the phenotype of more than 90% of the immune cells present in the biopsies, and overall fusion susceptibility was 13.6%.

