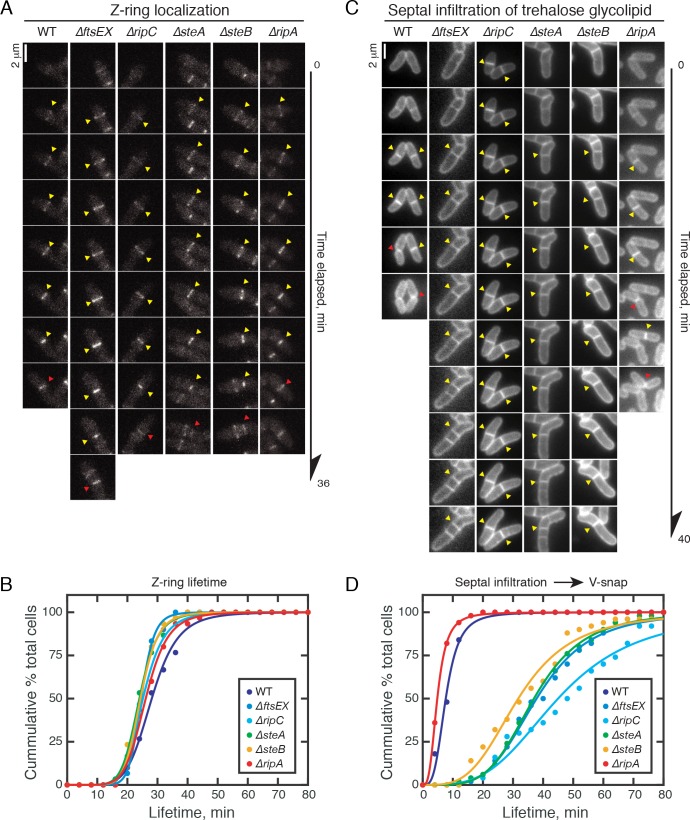
Fig 6. Assessment of the cell division phenotype of ste mutants.
(A) Shown are representative time-lapse fluorescence images used to follow Z-ring dynamics in MB001(WT) cells and its indicated derivatives. Yellow arrowheads denote Z-ring formation, and they transition to a red arrowhead at the time of observed resolution (note the expansion of the fluorescent band). These strains expressed msfGFP-ftsZ from the integrated pHCL106 plasmid as well as native ftsZ. Overnight cultures were diluted 1:1000 in BHI and grown at 30°C. When the OD600 reached 0.1, cells were loaded into a CellAsic microfluic plate and imaged by phase-contrast and fluorescence microscopy at 4-minute intervals. (B) Quantification of the Z-ring lifetime for each strain. The life-time of the Z-ring was defined as the time elapsed between Z-ring formation and its resolution, which was observed as the transition from a constricted band to an expanded band of lower fluorescence intensity. Z-ring lifetimes were manually measured for each strain and plotted as the cumulative percentage of cells with a lifetime less than or equal to a given time on the X-axis. The lifetime of thirty Z-rings was quantified for each strain. (C) The same cells in (A) were also monitored for the infiltration of trehalose glycolipid by exposing the cells with BHI supplemented with 100 μM 6-TMR-Tre for two minutes every 1 hour during imaging [34]. Representatives time lapse fluorescence images taken at 4 min intervals are shown for each strain. Yellow arrowheads denote septal infiltration of trehalose glycolipid and red arrows denote the V-snapping event. Note that the septa of ΔftsEX, ΔripC, ΔsteA and ΔsteB mutants eventually undergo V-snapping, but they are not shown here due the extreme delay. (D) V-snap delay was defined as the time elapsed between infiltration of trehalose glycolipid at the septum and V-snapping. It was quantified manually for each strain shown in (C) and plotted as cumulative percentage of cells with a V-snap delay less than or equal to a given time on the X-axis. Fifty infiltration events were quantified for each strain. For (C) and (D), solid lines represent best-fit curves of each dataset with the Hill equation: cumulative percentage = , in which τ characterizes the lifetime of Z-ring or the V-snap delay.

