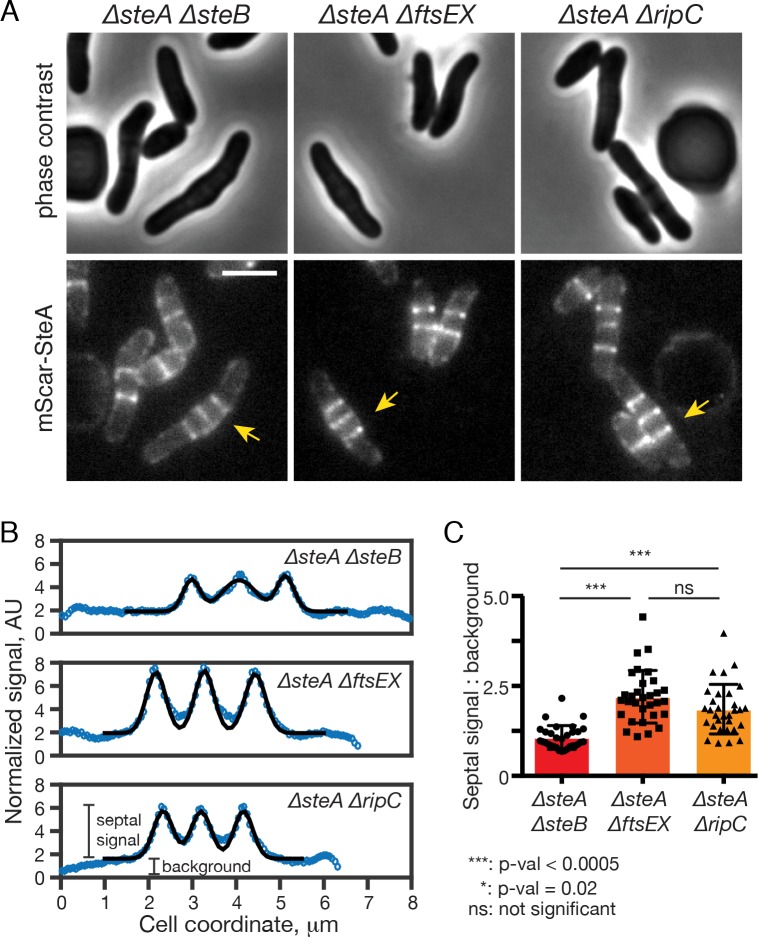
Fig 8. SteB is required for robust recruitment of SteA to the division site.
(A) Representative images of the indicated Cglu mutants producing mScar-SteA under PsteA from genome integrated pHCL171. Overnight cell cultures were diluted 1:1000 in BHI and grown at 30°C. When the OD600 reached 0.2–0.3, cell cultures were diluted 10-fold and loaded in a CELLASIC ONIX microfluidic device for phase-contrast and fluorescence microscopy. Scale bar: 2 μm. (B) Reduced accumulation of mScar-SteA signal at the division site in cells lacking SteB. Representative examples of mScar-SteA fluorescence profiles in the indicated strains using cells in (A) marked by yellow arrows. Cell detection and fluorescence quantification was performed using Oufti [60]. To quantify the background signal and the septal signal, the fluorescence profiles were fitted with multi-exponential Gaussians plus background (black line) using Matlab. The height of each Gaussian peak was taken as the value of septal signals. (C) Bar graphs comparing the septal mScar-SteA signal to background ratio of the indicated strains (31 septa from at least 18 cells from each strain were used for measurements). P-values (Tukey-Kramer test) report the statistical significance between the difference of the means using Prism software.

