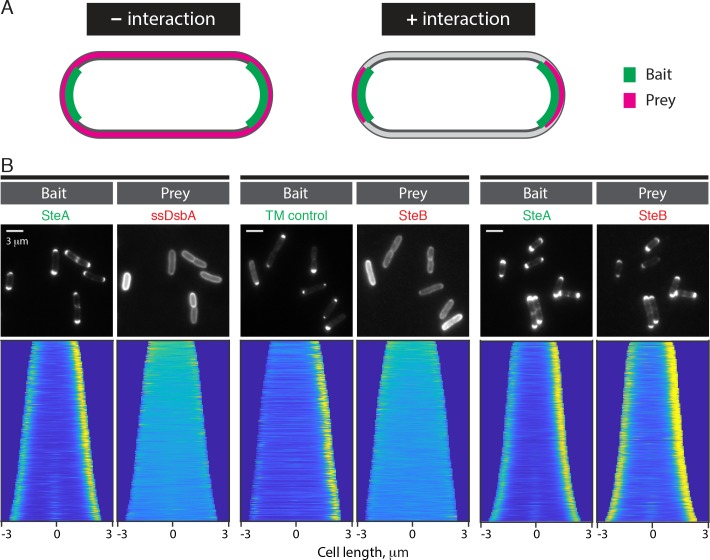
Fig 9. SteA and SteB form a complex.
(A) Schematic depicting the expected localization patterns of a prey depending on whether or not it interacts with the bait in the POLAR two hybrid assay. (B) Top row: representative fluorescence images of TB28 E. coli cells expressing the indicated the bait and prey proteins. The indicated baits were expressed using the following medium-copy plasmids: pHCL149 (TM control) and pHCL202 (SteA). The TM control harbors residues 2–55 of Pseudomonas aeruginosa PAO1 PonB covering its transmembrane domain that has a N-in/C-out topology. The preys were expressed from genome-integrated plasmids (pHCL147: ssDsbA and pHCL194: SteB). Cell cultures were grown from a single colony in LB supplemented with antibiotics at 37°C for two hours. To induce the bait and prey proteins, cells were collected by centrifugation and resuspended in M9 supplemented with 0.2% arabinose and 100 uM IPTG and grown for two hours at 37°C. Cells were spotted on an agarose pad for imaging. Bottom row: demographs showing fluorescence distribution of the corresponding prey and bait fusions at the population level. Single-cell fluorescence quantification was performed using Oufti [60]. Cells were oriented using a custom-written MATLAB script such that the cell pole with the higher bait fluorescence was located on the right of the demograph. At least 250 cells were used to generate each demograph.

