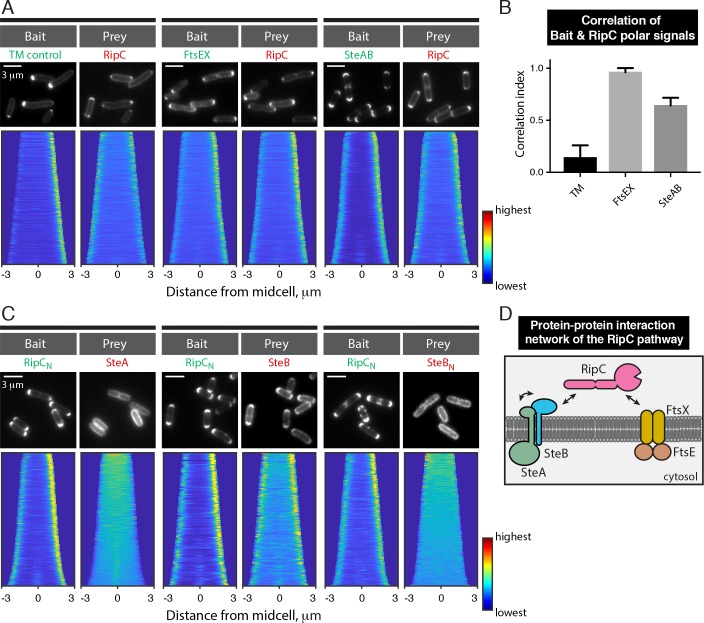
Fig 10. RipC interacts with both the SteAB and FtsEX complexes.
(A & C) Top row: representative fluorescence images of TB28 E. coli cells expressing the indicated the bait and prey proteins. The indicated baits were expressed using the following plasmids: pHCL149 (TM control), pHCL204 (SteAB), pHCL205 (FtsEX), pHCL213 (RipCN). The preys were expressed from genome-integrated plasmids (pHCL221: RipC, pHCL214: SteA, pHCL194: SteB and pHCL196: SteBN). Cells were grown and imaged as in Fig 9B. (B) Fluorescence correlation between the bait and the prey at the cell pole. To quantify the relative distribution of the the bait and prey between the poles, we first calculated fractional difference of the bait signal (Dbait) and the prey signal (Dprey) between the poles. The correlation between the bait and the prey signal distribution was represented by the correlation index (CI), which is the ratio of Dprey to Dbait. CI value of 1 indicates complete positive correlation, 0 indicates no correlation while -1 indicates complete negative correlation. A least 215 cells were used in each calculation (n = 2 for the FtsEX experiment and n = 3 for the control and the SteAB experiments). (D) Summary of the protein-protein interaction network of the RipC cell separation pathway.

