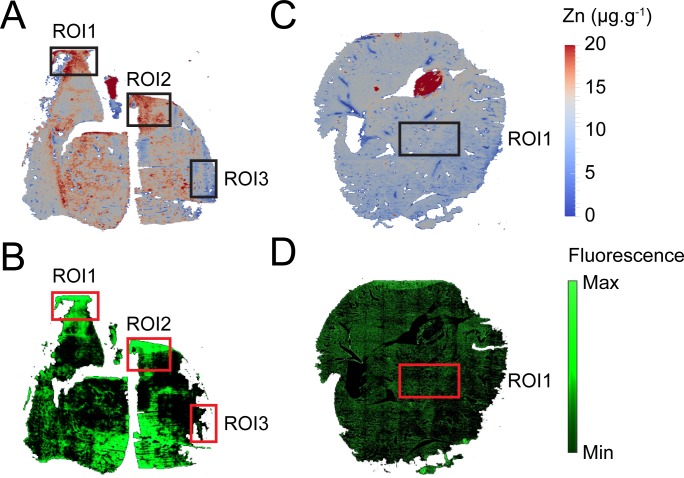
Fig 2. Co-localisation of S. pneumoniae and Zn in murine lung tissue.
Spatial distribution of Zn in the lungs of infected Zn-replete (A) or naïve Zn-replete (C) mice at 36 hrs post challenge. These data are representative elemental maps of murine tissue sections from at least two distinct murine samples by laser-ablation-ICP-MS with quantitated regions of interest (ROI) highlighted. The scale bar represents a heat map (blue to red) for the intensity of Zn from 0 to 20.0 μg.g-1. Spatial distribution of S. pneumoniae pVA838-GFP fluorescence in the lungs of infected Zn-replete (B) or naïve Zn-replete (D) mice at 36 hrs post challenge. The data are representative murine tissue sections from at least two distinct murine samples analysed by fluorescence microscopy with regions of interest (ROI) highlighted. The scale bar represents a heat map (black to green) for the relative fluorescence intensity.

