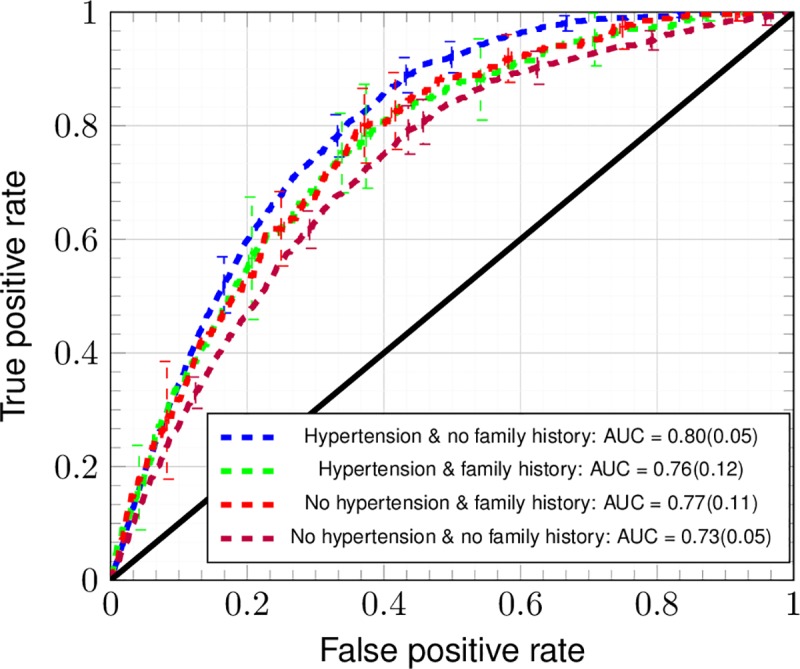
Fig 2. ROC curves of the ANN for ten-fold cross-testing dataset (TRIPOD 2a).

The ANN trained with the factors marked “default model” in Table 2 with (blue line) and without hypertension (purple line). The ANN was also trained on a reduced dataset that included family history with (green line) and without (red line) hypertension. Error bars denote the standard deviation of the TPR and FPR across ten folds of stratified cross-testing (TRIPOD level 2a).
