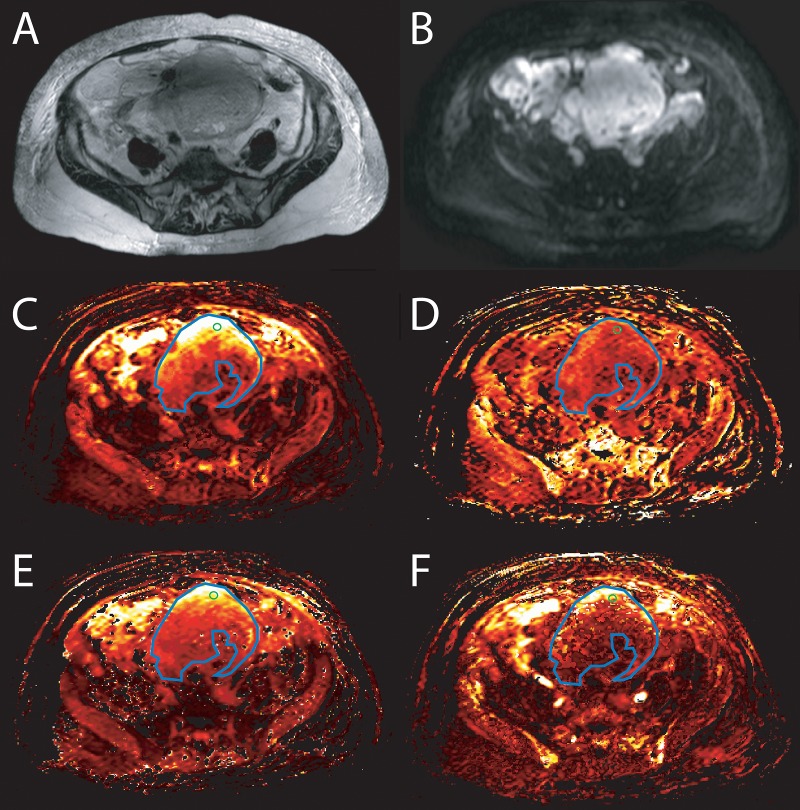
Fig 1. Image of a woman with a high grade ovarian carcinoma, FIGO stage IIIC.
A) A T2-weighted sequence illustrating a large cystic-solid tumor, B) in diffusion weighted image (DWI) tumor is bright. There is large region of interest (ROI) marked in blue color and a small ROI in green color drawn on the big solid part of the tumor (cystic and small solid parts between cysts was avoided). The ROIs were replicated onto color encoded C) Ktrans (a rate constant for transfer of contrast agent from plasma to the extravascular extracellular space (EES)) map, D) Kep (a rate constant from EES to plasma) map, E) Ve (contrast agent distribution volume) map and F) Vp (plasma volume fraction) map.

