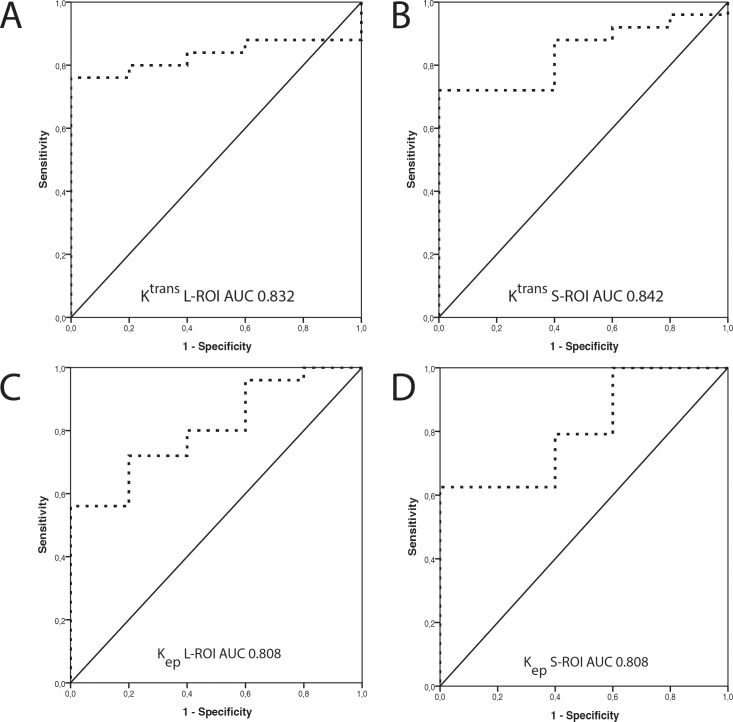
Fig 4. Analysis of ROC curves for the two DCE perfusion parameters, Ktrans and Kep, in the discrimination between low and high HIF-1α expression.
The analysis reveals the diagnostic accuracy of A) Ktrans L-ROI (AUC = 0.832) B) Ktrans S-ROI (AUC = 0.840), C) Kep L-ROI (AUC = 0.808) and D) Kep S-ROI (AUC = 0.808). HIF-1α expression dichotomized into low and high using the median immunoreactive score as the cutoff value.

