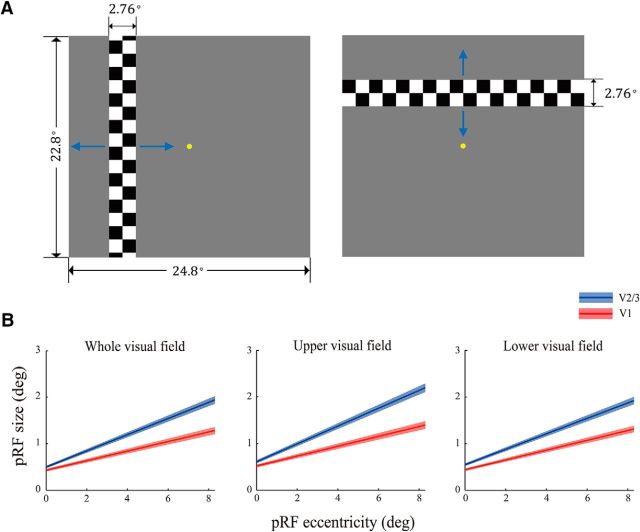
Figure 2.
pRF mapping. A, Stimuli used for pRF mapping. Blue arrows indicate the moving directions of the checkered bar in pRF mapping runs. Each bar moved in one direction and switched to the opposite direction when it reached the boundary of the mapped area. B, Relationships between pRF size and pRF eccentricity in the whole (left), the upper (middle), and the lower (right) visual field, respectively. The solid lines denote the linear fits relating the pRF eccentricity and the pRF size across subjects. SEs were estimated using a bootstrapped method (Kay et al., 2013), as indicated by the shaded band around each line.

