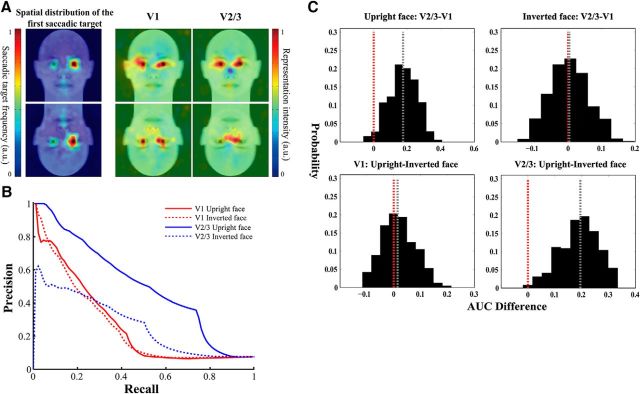
Figure 3.
Reconstructed topographic representations of face stimuli and their behavioral relevance. A, Visualization of the spatial patterns of the first saccadic target (left) and the reconstructed representations in V1 (middle) and V2/3 (right). B, Precision-recall curves corresponding to the reconstructed representations from which the behavioral relevance of these representations was measured as the AUC. C, Bootstrapped distributions of behavioral relevance (AUC) difference between the upright and inverted face representations and between the V1 and V2/3 representations. The red dotted line indicates the AUC difference of zero. The gray dotted line indicates the median of the bootstrapped distribution.

