Figure 2.

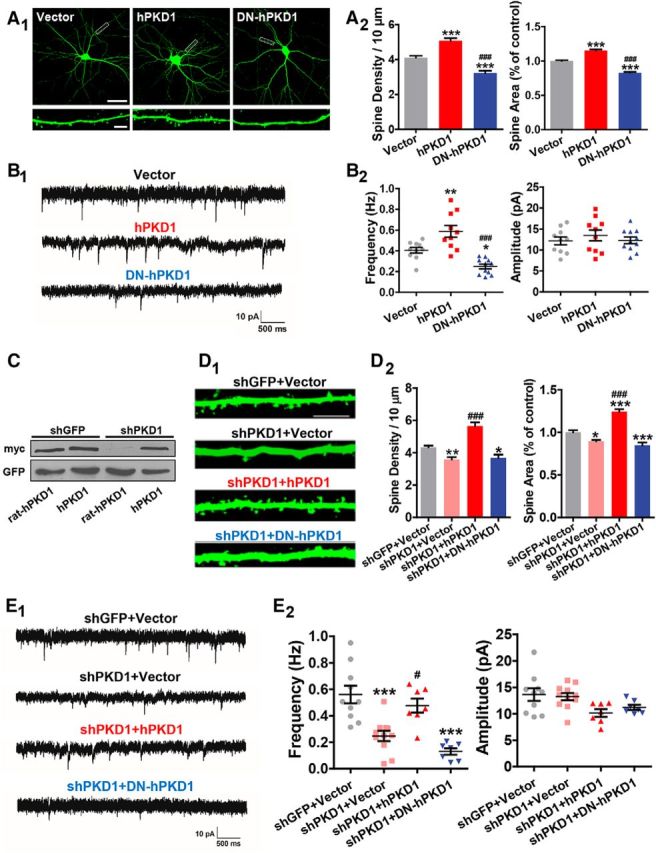
PKD1 is essential for synapse formation and function. A, Representative images and quantification of spine density and area in DIV 15 hippocampal neurons cotransfected GFP with his-myc-tagged Vector, hPKD1, or DN-hPKD1 at DIV 8 (n = 20, 16, 16 cells, respectively, in columns shown in the graphs). Scale bars: Top, 50 μm; Bottom, 5 μm. One-way ANOVA with Bonferroni's post hoc test: ***p < 0.001, compared with Vector. ###p < 0.001, compared with hPKD1. B, Representative traces (B1) and plots (B2) of mEPSC frequencies and amplitudes in hippocampal neurons cotransfected GFP with Vector, hPKD1, or DN-hPKD1 (n = 10, 10, 11 cells, respectively). Calibration: 10 pA, 500 ms. One-way ANOVA with Bonferroni's post hoc test: *p < 0.05, compared with Vector. **p < 0.01, compared with Vector. ###p < 0.001, compared with hPKD1. No significant differences in mEPSC amplitude were detected. C, Knockdown effect of myc-tagged rat PKD1 (rat-hPKD1) by shPKD1 in N2a cells. Rat-hPKD1 is an analog of hPKD1 with the rat target sequence of shPKD1 replacing the homologous domain in hPKD1 by site-directed mutagenesis. D, Representative images and quantification of spine density and area of DIV 15 hippocampal neurons transfected with shGFP+Vector, shPKD1+Vector, shPKD1+hPKD1, or shPKD1+DN-hPKD1 at DIV 8 (n = 18, 17, 15, and 16 cells, respectively). Scale bar, 2.5 μm. One-way ANOVA with Bonferroni's post hoc test: *p < 0.05, compared with shGFP+Vector. **p < 0.01, compared with shGFP+Vector. ***p < 0.001 compared with shGFP+Vector. ###p < 0.001, compared with shPKD1+Vector. E, Representative traces (E1) and plots (E2) of the mEPSCs in hippocampal neurons transfected with shGFP+Vector, shPKD1+Vector, shPKD1+hPKD1, or shPKD1+DN-hPKD1 (n = 10, 11, 7, and 7 cells, respectively). Calibration: 10 pA, 500 ms. One-way ANOVA with Bonferroni's post hoc test: **p < 0.01, compared with shGFP+Vector. ***p < 0.001, compared with shGFP+Vector. #p < 0.05 compared with shPKD1+Vector. No significant differences in mEPSC amplitude were detected among the groups. Data are mean ± SEM.
