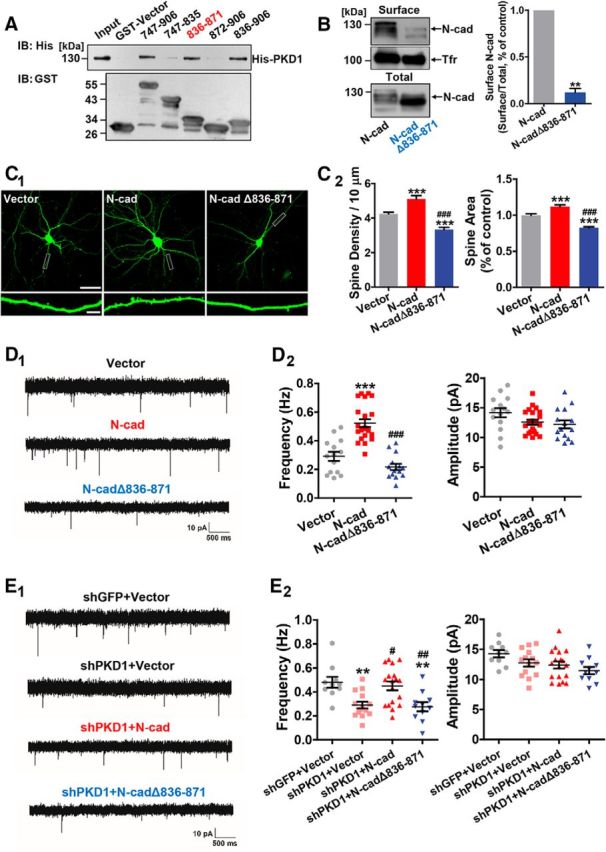
Figure 4.

PKD1 binds to N-cadherin at amino acid residues 836–871 and promotes functional synapse formation. A, Immunoblot of His-PKD1 pulldown by the indicated constructs of cytoplasmic N-cadherin. Top, Probed for His-PKD1 binding to cytoplasmic N-cadherin fused to GST. Bottom, Probed for total GST fusion protein present within each pulldown reaction. IB, Immunoblot. B, Membrane location of N-cadherin in N2a cells transfected with N-cad or N-cadΔ836–871 (N-cadherin with a deletion of amino acids 836–871); n = 3. **p < 0.01 (paired t test). C, Representative images and quantification of spine density and area of DIV 15 hippocampal neurons cotransfected GFP with Vector, N-cad, or N-cadΔ836–871 at DIV 8 (n = 16, 15, and 17 cells, respectively). Scale bars: Top, 50 μm; Bottom, 5 μm. One-way ANOVA with Bonferroni's post hoc test: ***p < 0.001, compared with Vector. ###p < 0.001, compared with N-cad. D, Representative traces (D1) and plots (D2) of mEPSC frequencies and amplitudes in hippocampal neurons cotransfected GFP with Vector, N-cad, or N-cadΔ836–871 (n = 14, 22, and 15 cells, respectively). Calibration: 10 pA, 500 ms. One-way ANOVA with Bonferroni's post hoc test: ***p < 0.001, compared with Vector. ###p < 0.001, compared with N-cad. E, Representative traces (E1) and plots (E2) of frequencies and amplitudes of the mEPSCs in hippocampal neurons transfected with shGFP+Vector, shPKD1+Vector, shPKD1+N-cad, or shPKD1+N-cadΔ836–871 (n = 10, 14, 18, and 11 cells, respectively). Calibration: 10 pA, 500 ms. One-way ANOVA with Bonferroni's post hoc test: **p < 0.01, compared with shGFP+Vector. #p < 0.05, compared with shPKD1+Vector. ##p < 0.01, compared with shPKD1+Vector. No significant differences in mEPSC amplitude were detected among the groups. Data are mean ± SEM.
