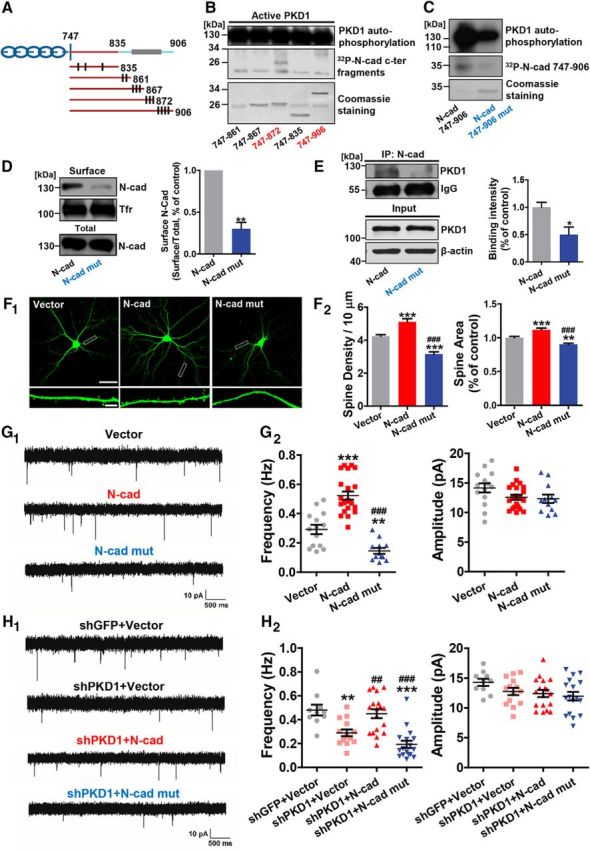
Figure 5.

PKD1 phosphorylates N-cadherin at Ser 869, 871, and 872 and promotes functional synapse formation. A, Schematic depiction of cytoplasmic N-cadherin constructs illustrating the approximate localization of serine and threonine residues (black lines) that represent potential sites of phosphorylation by PKD1. B, His-747–906 and His-747–872 containing the potential phosphorylation sites Ser 869, 871, and 872 were phosphorylated by PKD1. C, N-cadherin c-ter (His-N-cad-747–906) phosphorylation by purified PKD1 was reduced by the triple mutation (His-N-cad-747–906 mut) as shown by in vitro kinase assay. D, Membrane location of N-cadherin in N2a cells transfected with N-cad or Ν-cad mut (N-cadherin with Ser 869, 871, and 872 mutated to alanine); n = 4. **p < 0.01 (paired t test). E, Coimmunoprecipitation of N-cadherin with PKD1 in N2a cells transfected with N-cad or N-cad mut; n = 3. *p < 0.05 (unpaired t test). IP, Immunoprecipitation. F, Representative images and quantification of spine density and area of DIV 15 hippocampal neurons cotransfected GFP with Vector, N-cad, or N-cad mut at DIV 8 (n = 16, 15, 18 cells, respectively). Same Vector and N-cad data as in Figure 4C. Scale bars: Top, 50 μm; Bottom, 5 μm. One-way ANOVA with Bonferroni's post hoc test: **p < 0.01, compared with Vector. ***p < 0.001, compared with Vector. ###p < 0.001, compared with N-cad. G, Representative mEPSC traces (G1) and plots (G2) of the frequencies and amplitudes of hippocampal neurons cotransfected GFP with Vector, N-cad, or Ν-cad mut (n = 14, 22, 12 cells, respectively). Same Vector and N-cad data as in Figure 4D. Calibration: 10 pA, 500 ms. One-way ANOVA with Bonferroni's post hoc test: **p < 0.01, compared with Vector. ***p < 0.001, compared with Vector. ###p < 0.001, compared with N-cad. H, Representative traces (H1) and plots (H2) of frequencies and amplitudes of the mEPSCs in hippocampal neurons transfected with shGFP+Vector, shPKD1+Vector, shPKD1+N-cad, or shPKD1+N-cad mut (n = 10, 14, 18, and 17 cells, respectively). Same shGFP+Vector, shPKD1+Vector, and shPKD1+N-cad data as in Figure 4E. Calibration: 10 pA, 500 ms. One-way ANOVA with Bonferroni's post hoc test: **p < 0.01, compared with shGFP+Vector. ***p < 0.001, compared with shGFP+Vector. ##p < 0.01, compared with shPKD1+Vector. ###p < 0.001, compared with shPKD1+Vector. No significant differences in mEPSC amplitude were detected among the groups. Data are mean ± SEM.
