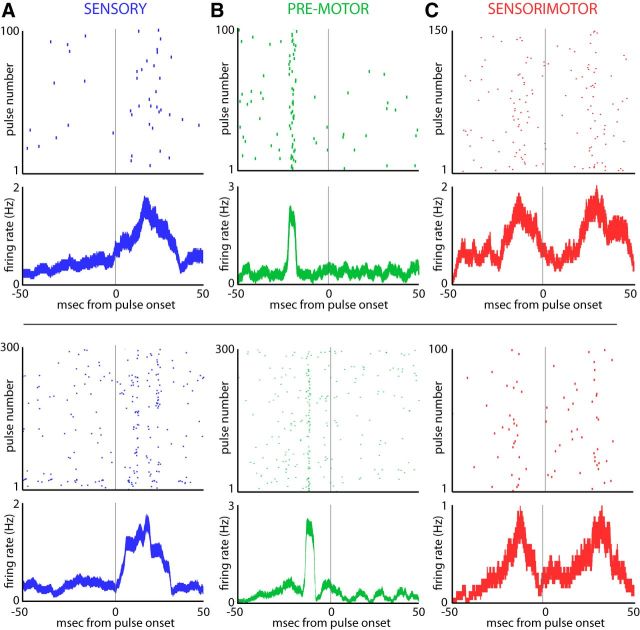
Figure 2.
Sensory and motor activity in the SC. A, Top, Raster and firing rate plot of activity if a single SC neuron demonstrating a sensory or auditory response. For both the raster plot and peristimulus time histogram, activity is aligned to the onset of sonar vocalizations at zero. Tick marks in the raster plot show the time of spiking with respect to vocal onset, with 100 unique vocalizations stacked vertically. For this neuron, activity occurs after sonar vocal onset when the echo arrives and is therefore an auditory responsive neuron. The firing rate plot displays the mean ± SE of the firing rate of the neuron, also aligned to sonar vocal onset. Bottom, Example of another SC neuron with a sensory response to echo arrival. B, Top, Raster and firing rate plot for an SC neuron that is active before sonar vocal onset (the zero time point). This neuron is active ∼20 ms before vocal onset and is therefore categorized as premotor. Bottom, Another example of a neuron with an increase in activity before sonar vocal onset. C, Top, Raster plot and firing rate plot of a neuron with both vocal premotor activity and a sensory response after sonar vocal onset. This neuron is therefore classified as sensorimotor. Bottom, Another example of a sensorimotor neuron.

