Figure 4.
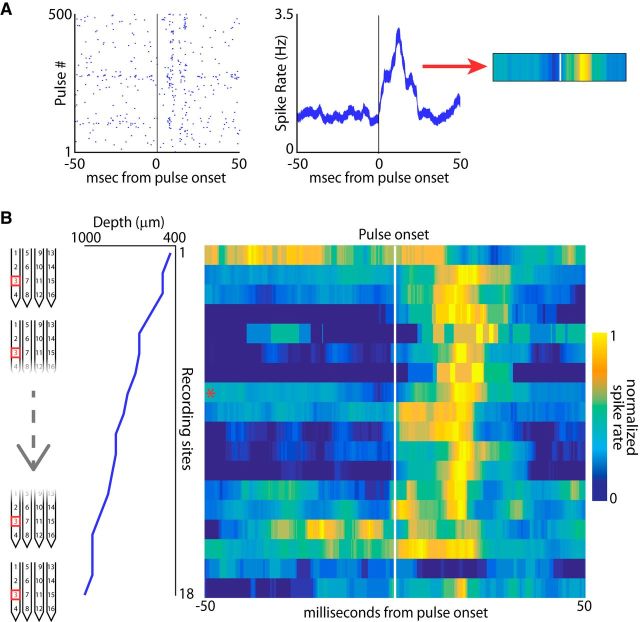
SC activity throughout recording depths for one channel (channel 3) of the silicon probe. A, Methodology of converting a spike raster into a heat plot for further analysis. Left, Spike raster for an SC neuron with activity after sonar vocal onset for 500 different vocalizations. Middle, Conversion of the spike raster into a firing rate plot displaying the average firing rate of the neuron with respect to the onset of the vocalization (zero time-point). The average firing rate in a 100 ms window aligned at vocal onset is then mapped onto a color spectrum from blue to yellow, with yellow representing the peak firing rate for that neuron (right, white line indicates pulse onset). B, Reconstruction of time-aligned SC activity throughout recording depths for channel 3 on the silicon probe (left column). This channel recorded different neurons at 18 locations across 600 μm of layers in the SC (middle column). Right, Average activity of each neuron recorded arranged by depth and color coded as in A with yellow representing the peak firing rate and blue the minimum firing rate. Vocal onset is indicated with the white line; asterisk indicates neuron shown in A.

