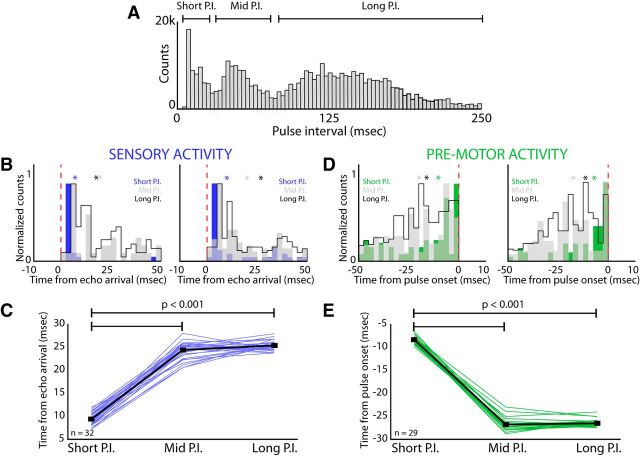
Figure 7.
Effects of vocal motor production upon sensory responses. A, Distribution of PIs while bats tracked moving targets. There was a trimodal PI distribution, resulting in three different categories of PI: short PIs of <25 ms, middle PIs of 30–60 ms, and long PIs of 75–250 ms. B, Latency from echo arrival to spike time for two sensory neurons (left and right) broken down by the PI of the ongoing vocalizations. For these two example sensory neurons, the latency from echo arrival to spike time is significantly shorter for the smallest PI category (short PI in blue, p = 0.001 for left example, p = 0.002 for right example, permutation test for both comparisons). C, Change in latency from echo arrival to spike time across the three PI categories for sensory neurons (n = 32 neurons, minimum of 50 vocalizations in each PI category; asterisks denote mean values, colors as described). There is a significant decrease in the spike latency for echoes returned from short PI vocalizations compared with the middle and long PI vocalizations (p = 0.0002 for both comparisons, two-tailed t test). D, Lead time from spike time to pulse onset for two motor neurons (left and right). For both example motor neurons, the lead time from spike time to pulse onset is significantly shorter when the bat is producing vocalizations at the shortest PI (short PI in green, p = 0.001 for left example, p = 0.02 for right example, permutation test for both comparisons; asterisks denote mean values, colors as described). E, Change in lead time from spike time to pulse onset across the three PI categories for motor neurons (n = 29 neurons, minimum of 50 vocalizations in each PI category). There is a significant decrease in spike lead time to pulse onset for short PI vocalizations compared with the middle and long PI vocalizations (p = 0.0005 for both comparisons, two-tailed t test).

