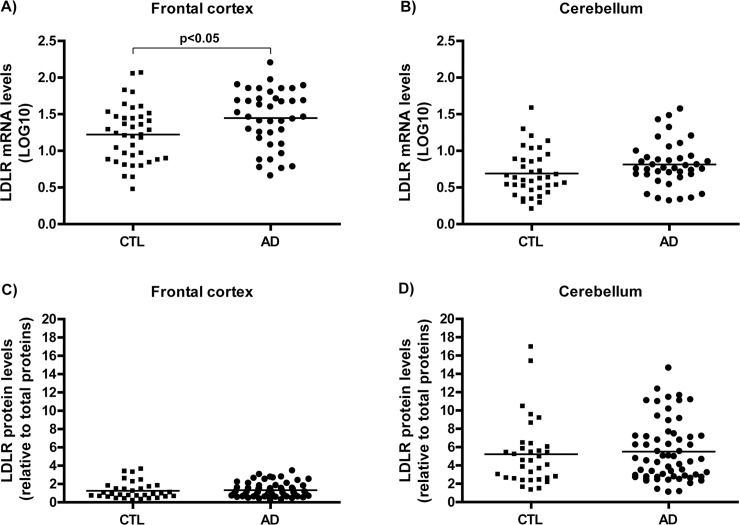
Fig 2. LDLR expression levels in AD compared to control brains.
Relative LDLR mRNA levels in A) frontal cortices and B) cerebella of AD and control brains from the QFP quantified by RT-PCR. Relative LDLR protein levels in C) frontal cortices and D) cerebella of AD and control brains quantified by ELISA. AD, Alzheimer’s disease; CTL, controls; mRNA, messenger ribonucleic acid; LDLR, low density lipoprotein receptor.

