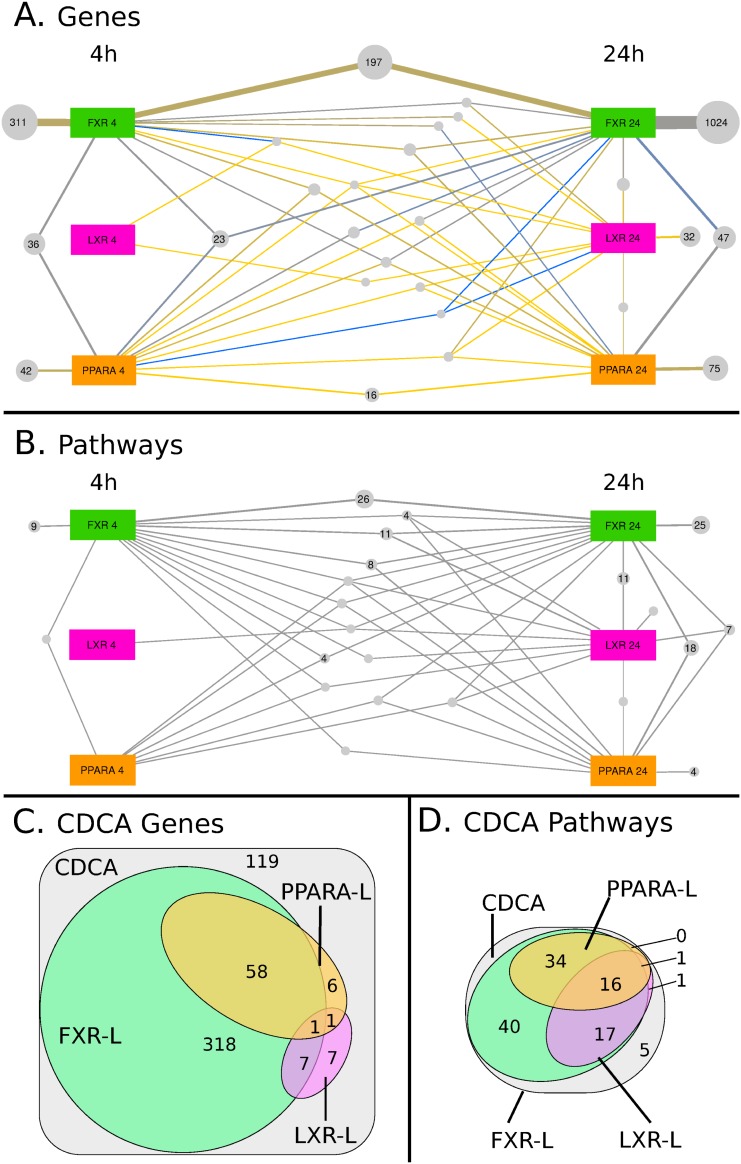
Fig 1. Visual Representation of the specific and shared effects of the treatments.
(A, B) Panels A and B show the overlapping effects at both time-points of the 3 synthetic ligands (FXR-L, LXR-L, and PPARA-L). Large colored squares denote the treatments at 4h (on the left) or at 24h (on the right), while grey bubbles denote groups of regulated genes (A) or of enriched pathways (B), which are associated to the same set of treatments. For example, panel A shows that 1532 genes are regulated only by FXR-L: 311 only after 4h, 197 at both time-points and 1024 only at 24h. The size of the bubbles and of the connections with their associated treatments is proportional to the number of genes or pathways in the group. In panel A, the color of the connection further indicates the ratio between genes that are activated (yellow) or inhibited (blue) by this treatment. The original Cytoscape files are available as supplementary material and a summary of the observed overlap is available in Table 1. (C, D) The Venn diagrams in panels C and D show the overlapping effects of the CDCA natural ligand with the 3 synthetic ligands, without further separating the time-points for the sake of simplicity. The areas denote groups of regulated genes (C) or of enriched pathways (D) affected by the CDCA treatment.

