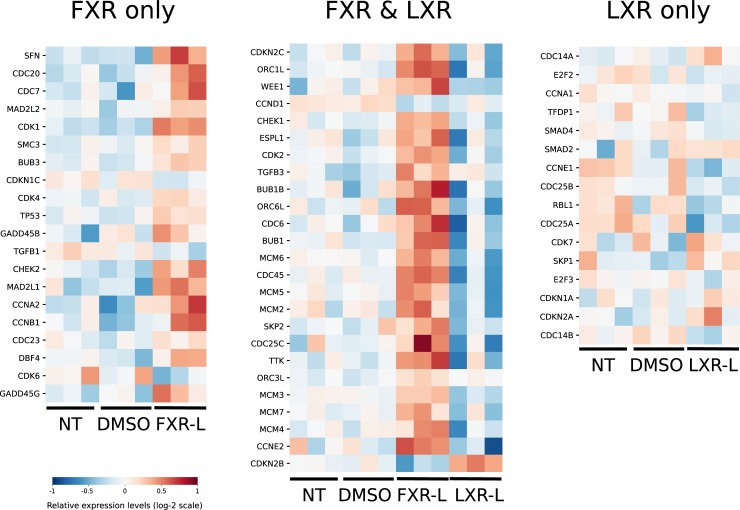
Fig 2. Effect of FXR-L and LXR-L treatments on genes associated to the cell-cycle pathway.
These heatmaps show the expression levels of genes driving the cell-cycle pathway at 24h for the FXR-L and LXR-L treatments compared to the controls (non-treated (NT) and DMSO-treated) according to GSEA (see methods and supplementary material). For each gene, the 9 experimental values (normalized microarray expression levels) are centered around their mean (in white). Higher values appear in red, while lower values are blue. Each of the 3 heatmaps corresponds to a group of genes belonging to the cell cycle pathway that are affected by only FXR-L on the left, only LXR-L on the right) or by both treatments (center). With FXR-L treatment, most genes are up-regulated, while they are down-regulated with LXR-L. Among the 25 genes regulated by the two treatments, only 3 have the same profile in the two conditions (TGFB3, ORC3L and CCND1).

