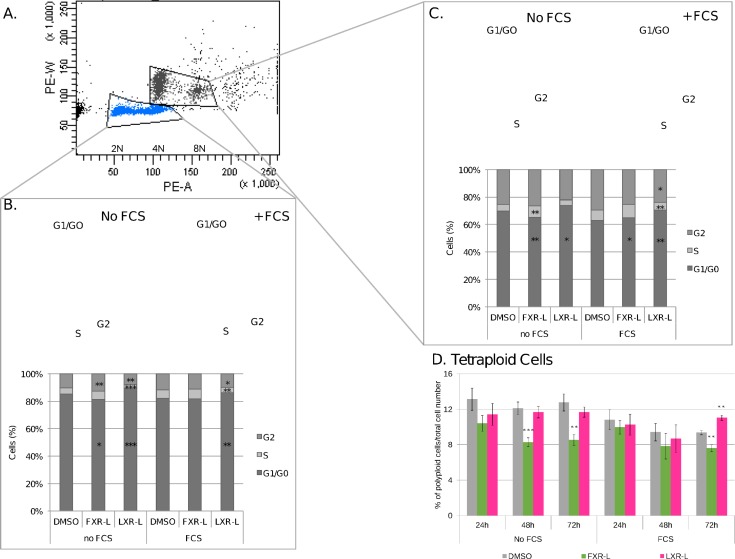
Fig 4. FXR and LXR affect the cell progression and the ploidy of HepaRG cells.
The cell cycle distribution and the ploidy were analyzed by PI staining and FACS. (A) The panel shows the group of HepaRG cells, the diploid cells (2N) and tetraploid cells (4N), (B, C) The panels and the graphs show the cell cycle distribution at 72h of treatment with DMSO, FXR-L 1 uM or LXR-L 2 uM. D. The graph shows the percentage of tetraploid cells at 24h, 48h and 72h with the different treatments. *: p-value < 0.05, ** < 0.01, *** < 0.001 versus DMSO (Student’s t test). N = 8.

