Fig 5.
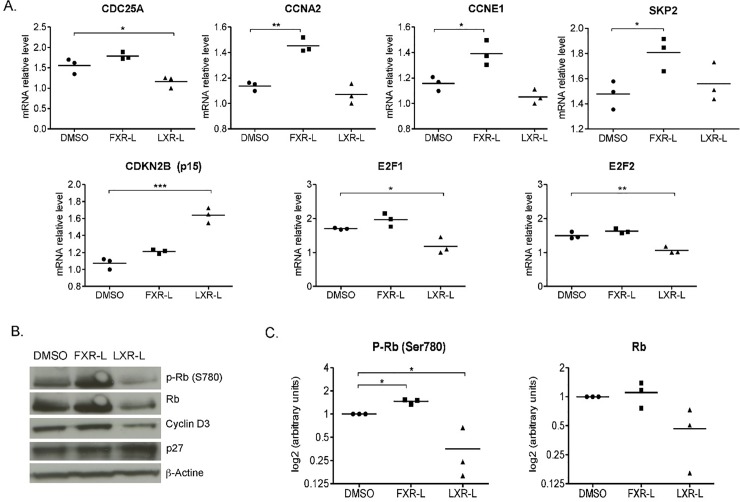
Validation of the effects of FXR and LXR on cell cycle regulators by RT-qPCR (A) and Western blot (B). HepaRG cells have been treated 24h in the same condition as for the microarrays (same ligands and DMSO as control). (A) Relative mRNA levels for genes regulated in the microarray data. (B) Representative Western blot of Retinoblastoma (Rb), phospho-Rb, Cyclin D3, and p27 in whole HepaRG cell lysates. (C) densitometric quantification of phospho-Rb and Rb. *: p-value < 0.05, ** < 0.01 versus DMSO (Student’s t test). N = 3.

