Figure 5.
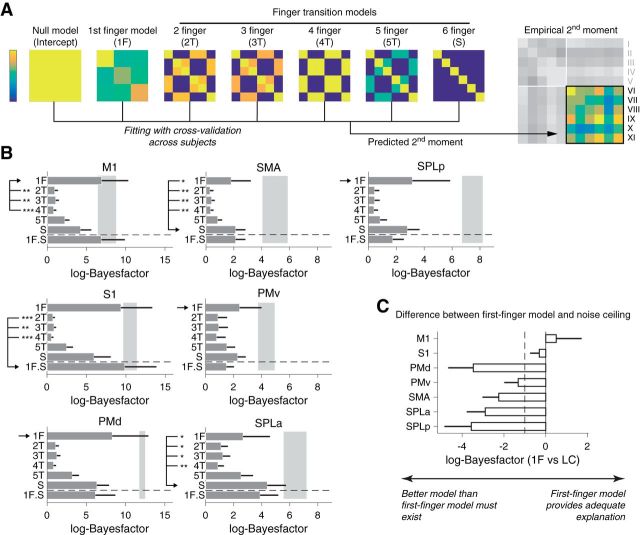
Evaluating representational models of multi-finger sequences. A, The empirical second moment of the activity patterns for the multi-finger sequences (a 6 × 6 matrix: on the right) is modeled using a combination of the predicted second moment matrices for each of the models. As in a covariance matrix, high values (yellow) indicate tight correspondence between the two activity patterns, whereas low values (blue) indicate uncorrelated activity patterns. B, The difference in log-likelihood compared with the null-model (log-Bayes-factor) for each component model. The gray area denotes the upper and lower noise ceiling. The combination of the first-finger model and the six-finger transition model (1F.S) is shown below the horizontal dashed line. The winning model is marked by the arrow. Significant differences (assessed by Wilcoxon's rank sum test on individual log-Bayes-factors) between the winning and the other models are marked by asterisks (*p < 0.05, **p < 0.01, ***p < 0.001). Error bars represent SE across subjects. C, Log-Bayes-factor of the first-finger model compared with the lower noise ceiling for each ROI. The dashed line shows the typical threshold value for model selection (Kass and Raftery, 1995).

