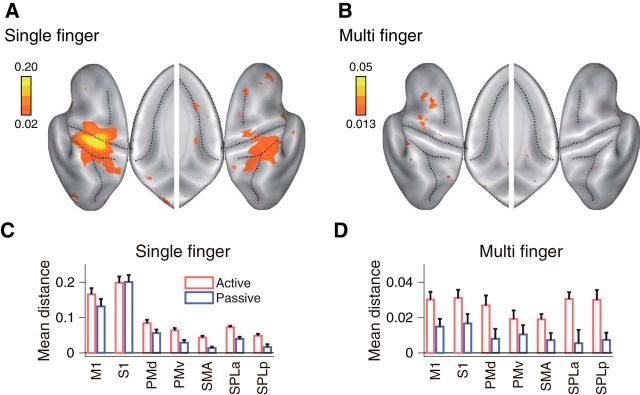
Figure 6.
Passive stimulation elicited comparable single-finger representation, but reduced multi-finger sequence representation. A, The averaged distance for single-finger sequences, and (B) multi-finger sequences shown on an inflated view of the left and right cortical hemisphere, with the inset showing the medial wall. C, Average distance in the cortical ROIs (Fig. 3C) for single-finger sequences for active (red) and passive (blue) conditions. D, Average distance across all pairs for multi-finger sequences. Error bars represent SE across subjects.

