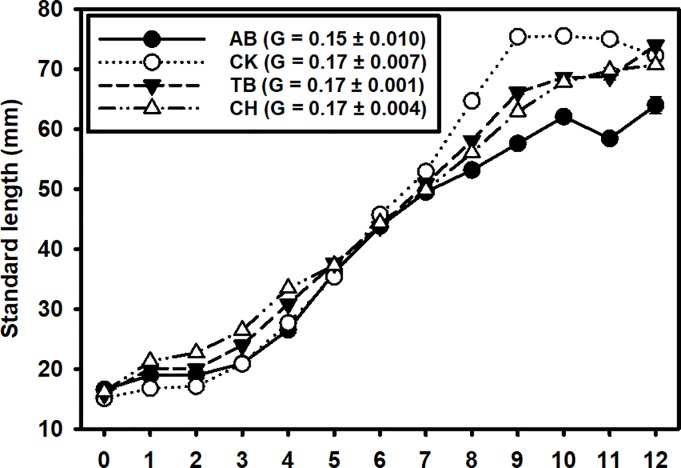
Fig 6. Pinfish growth.
Spatio-temporal variation of mean Pinfish standard length among estuaries intra-annually. Means (± SE) of the instantaneous growth rates (G) between April and July for each estuary are reported in the legend. Months are in order of calendar year (i.e., 1 = January, 12 = December), with month 0 representing sizes from the smaller cohort of new YOY recruits in December of the previous year.

