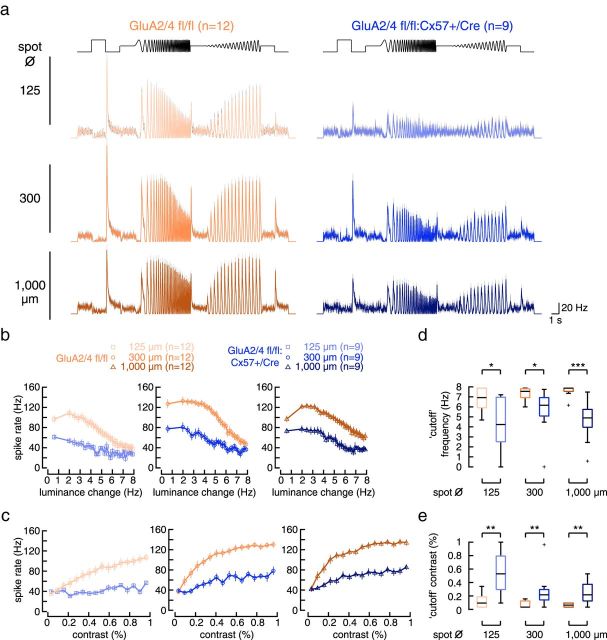
Figure 5.
In GluA2/4-deficient mice, the dynamic range of light responses in tOFF-αRGCs was compressed. a, Spike rates (bin size, 20 ms) of tOFF-αRGCs from control and GluA2/4-deficient mice to chirp stimuli of 125, 300, and 1000 μm diameter. Values are shown as mean ± SEM, with means presented as solid colored lines and SEM as gray shades. b, c, Peak spike rate plotted against temporal frequency (b) or contrast (c) for the two genotypes and all three spot sizes (values are presented as mean ± SEM). Differences between genotypes were significant at all spot sizes (frequency: genotype effect: p < 0.0011 for all comparisons; contrast: genotype effect: p < 0.0026 for all comparisons; two-way ANOVA for repeated measures). d, e, “Cutoff” frequency (d) and contrast (e), i.e., the highest frequency and the lowest contrast that elicited a response (see Materials and Methods) were determined. Crosses represent outliers. Differences between genotypes were significant at all spot sizes (frequency: p < 0.02 for all comparisons; contrast: p < 0.0086 for all comparisons; Wilcoxon rank sum test), indicating that cells from GluA2/4-deficient mice failed to respond to high-frequency or low-contrast stimuli. *p < 0.05; **p < 0.01; ***p < 0.001.

