Figure 7.
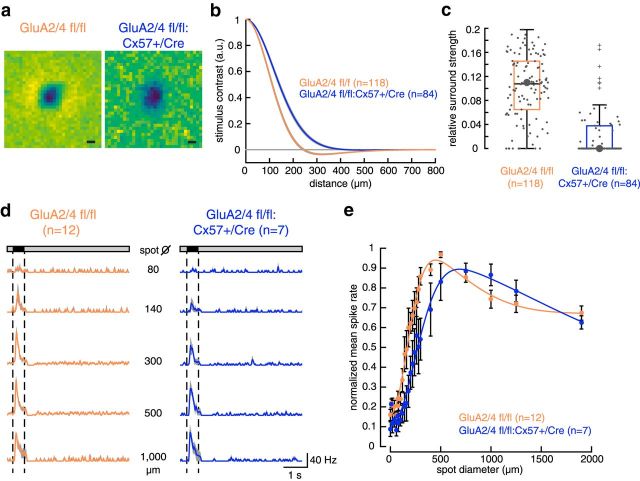
In GluA2/4-deficient mice, tOFF-αRGCs showed altered centers and surrounds. a, Representative examples of spatial receptive fields of tOFF-αRGCs from control and GluA2/4-deficient mice obtained by a logistic regression model (see Materials and Methods). The dark region, indicating a dominant OFF response, was surrounded by an aggregation of light regions in the control (left), indicating an antagonistic receptive field surround, which is absent in the spatial receptive field of GluA2/4-deficient mice (right). Scale bar, 100 μm. b, Cross-sectional profile of receptive fields for 118 control and 84 GluA2/4-deficient tOFF-αRGCs. Mean across difference of Gaussians fits is shown. Shaded area represents 1 SEM. c, Box plots showing the ratio of center and surround amplitude. Large points represent cells shown in a. Crosses represent outliers. d, Averaged spike rates (bin size 20 ms) of tOFF-αRGCs from control and GluA2/4-deficient mice in response to selected spots of increasing diameter. Data are plotted as mean ± SEM, with means presented as solid colored lines and SEM as gray shades. Dotted lines represent the stimulus. e, Mean normalized spike rates were fit with a difference of two Gaussians model. Both genotypes showed the characteristic feature of antagonistic receptive field organization: increase in firing with increasing spots until a maximum was reached and a successive decline in firing rates with further increasing spot sizes. However, center and surround sizes were larger in GluA2/4-deficient mice. Also, the ratio of center/surround strength was larger in GluA2/4-expressing mice (2.3) than in GluA2/4-deficient mice (1.5). Fit parameters: GluA2/4 fl/fl: R0 = 0.16; kc = 0.9; σc = 83 μm; ks = 0.39; σs = 295 μm; R2 = 0.98; +/Cre: R0 = 0.1; kc = 0.87; σc = 121 μm; ks = 0.57; σs = 700 μm; R2 = 0.98. Values are shown as mean ± SEM.

