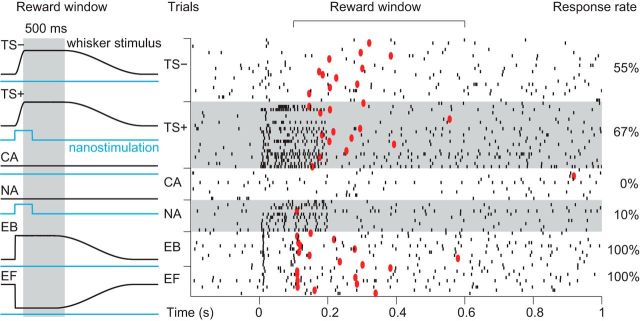
Figure 2.
Example nanostimulation experiment. Left, Six types of trials were presented during single-cell-stimulation experiments. Licks were rewarded within the 100–600 ms window after stimulus onset (gray box) for all six trial types (black, whisker movement; blue, nanostimulation). The time of the first lick was taken as the reaction time. Right, Behavioral and neuronal responses in a nanostimulation experiment on a putative excitatory neuron (out of a population of 167 cells). The cell was recorded at a depth of 892 μm and fired action potentials in response to stimulation of the C1 whisker. The raster plot depicts action potentials (ticks) and first lick responses (red filled circles) during the six different trial types. Stimulus onset is at time 0. Behavioral responses are quantified on the right as a percentage of the total number of trials for each trial type.

