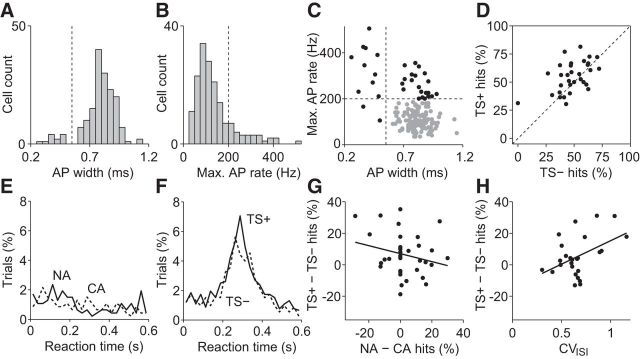
Figure 4.
Initiation of action potentials in single fast-spiking inhibitory neurons induces a sensory detection increase. A, Bimodal distribution of AP widths across cells (n = 167). Neurons with AP widths (measured peak-to-trough) less than or equal to 0.5 ms were classified as FS cells. B, Distribution of maximum firing rates across cells during nanostimulation trials. Note that no special effort was made to fire cells at maximum rates. Neurons that fired 40 APs or more (i.e., ≥200 Hz; vertical dotted line) during at least one of the NA trials were classified as FS cells. C, Joint distribution of maximum firing rates and AP widths. Cells with maximum firing rate of below 200 Hz and AP width larger than 0.5 ms were classified as putative excitatory neurons (gray circles), the other cells as FS putative inhibitory neurons (black circles). D, Response rates (hits) in TS+ trials versus TS− trials in experiments on FS cells (n = 33). Single-cell stimulation increased the mean response rate by 6.3%. E, Average reaction time histograms for NA and CA trials (25 ms bins). F, Average reaction time histograms for TS+ and TS− trials (25 ms bins). G, The response change induced by nanostimulation alone (NA hits minus CA hits) was not correlated with the sensory detection change induced in whisker stimulation trials (TS+ hits minus TS− hits). Data in D–G are from experiments on FS cells (n = 33). H, Spike train irregularity during nanostimulation displayed a positive correlation with sensory detection change (n = 26 FS cells).

