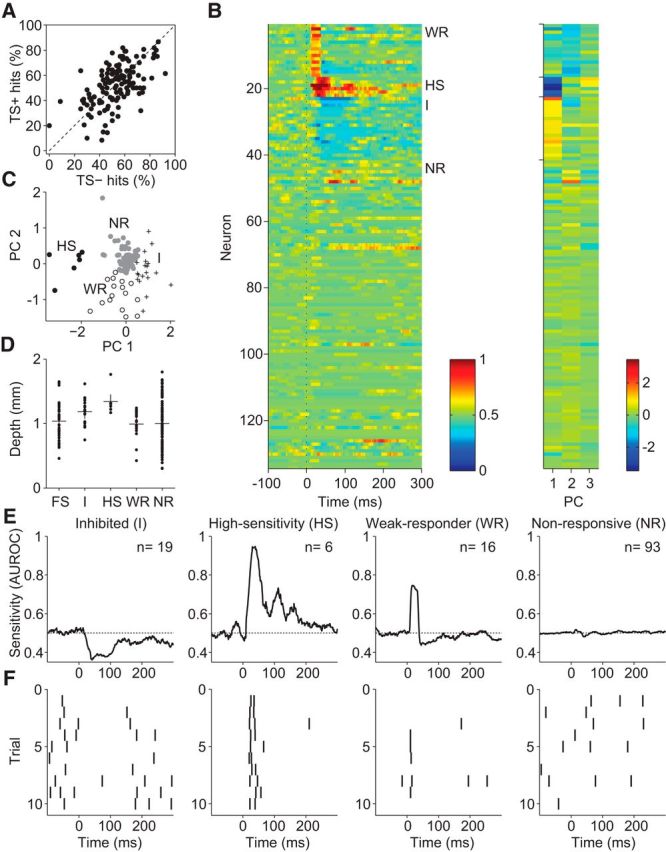
Figure 5.

Putative excitatory cells can be subdivided into four whisker-response categories. A, Response rates (hits) in TS+ trials versus TS− trials in all experiments on putative excitatory neurons (n = 134). Single-cell stimulation did not affect the mean response rate when excitatory neurons were considered as one large group. B, Temporal response profiles of excitatory neurons to EB whisker stimulation and their first three principal component scores. C, Temporal response profiles of excitatory neurons to EB whisker stimulation were classified into four clusters (I cells, n = 19, plus signs; HS cells, n = 6, black dots; WR cells, n = 16, open circles; NR cells, n = 93, gray dots). Axes represent the first two principal component scores of the response profiles. D, Depth meter readings for individual neurons (dots) together with group averages (plus signs). E, Average temporal response profiles for the four different clusters, with stimulus onset at time 0. HS neurons reached maximal sensitivity (39 ms after stimulus, endpoint of 25 ms bin) later than WR neurons (16 ms after stimulus). Gray regions indicate bootstrapped 95% confidence intervals. F, Raster plots depicting spike responses in 10 EB whisker stimulation trials for, from left to right, an example I cell, HS cell, WR cell, and NR cell.
