Figure 8.
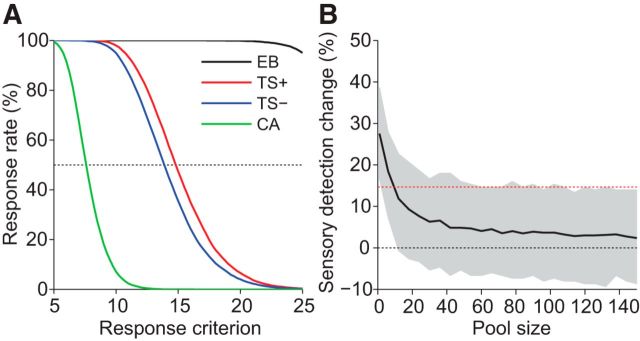
Threshold detection model. A, Response rates for the four different trial types in the model when the decision pool included 12 HS cells. Single-cell stimulation was applied to one of the model neurons (TS+ trials). The response criterion was set to obtain a response rate of 50% in TS− trials. B, The sensory detection change (TS+ hits minus TS− hits) induced by single-HS-cell stimulation decreased as a function of the number of HS cells included in the decision pool. The black line indicates the mean sensory detection change in the model for a set of six single-cell-stimulation experiments (1 per HS cell). The red line indicates the mean sensory detection change obtained in behavioral experiments on HS cells. The gray area represents the 95% confidence interval for the mean sensory detection change in the model. The decrease of sensory detection change with pool size was well described by a double exponential decay (r2 > 0.99) or a rational function of degree one for both the numerator and denominator (r2 > 0.99).

