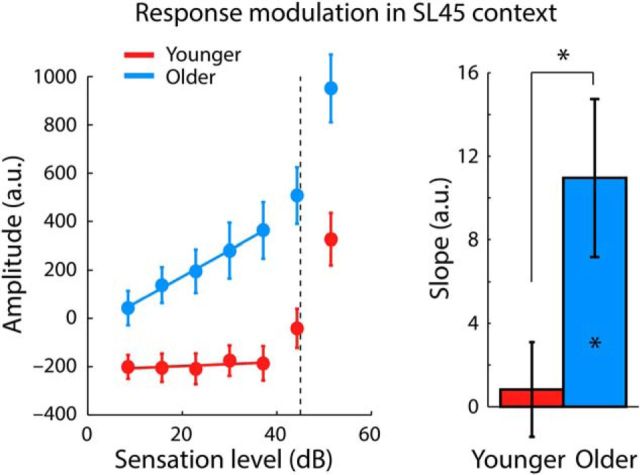
Figure 7.
Response sensitivity to sound level in the 45 dB SL context for sound levels lower than the high-probability region. Left, Same data as that from the 45 dB SL context displayed in Figure 6A. The dashed vertical line at 45 dB SL marks the center of the high-probability region. The colored solid lines reflect the averaged predicted values from participant-specific linear fits. Right, Slope of a linear function fit to responses as a function of the sound levels below the high-probability region revealed a response sensitivity for older but not for younger adults (right). *p < 0.05. Error bars indicate SEM.

