
Figure 6.
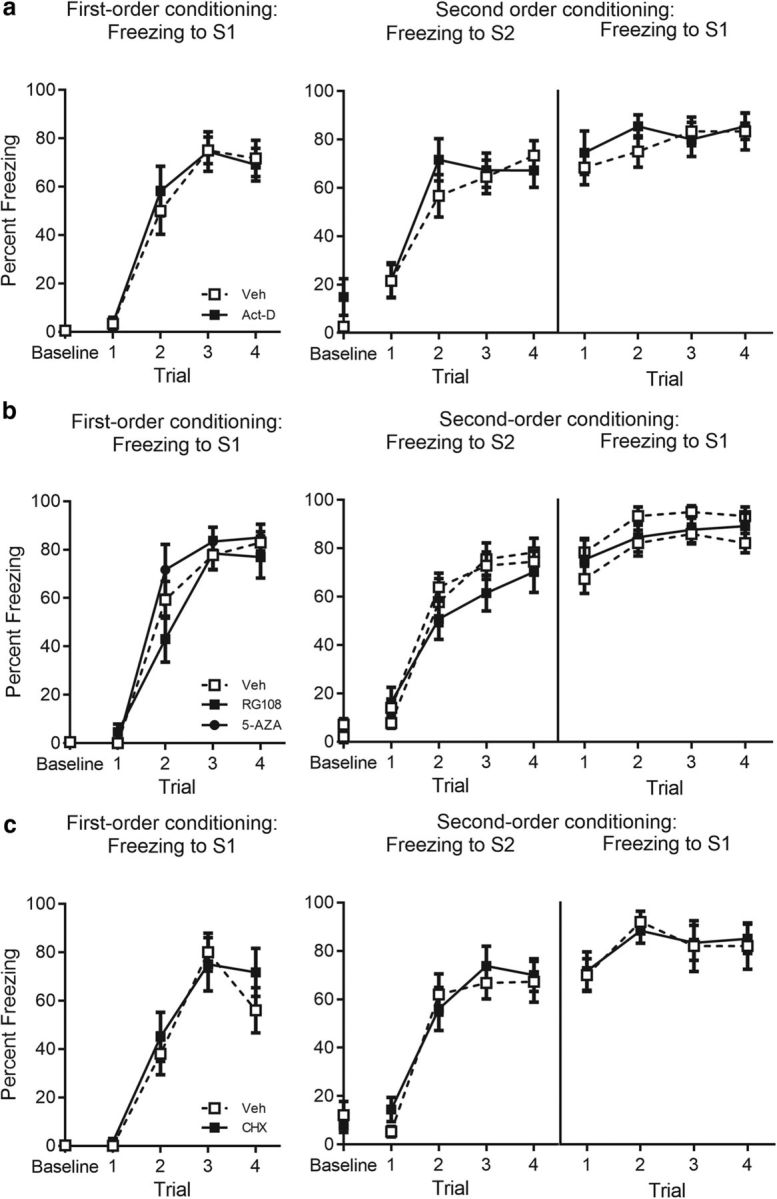
Acquisition data for experiments targeting gene transcription, DNA methylation, and protein synthesis in the BLA. a, Percentage freezing to S1 across first-order conditioning (left) and S2 and S1 across second-order conditioning (right) for actinomycin-d- (n = 11) and vehicle- (n = 12) treated rats. b, Percentage freezing to S1 across first-order conditioning (left) and S2 and S1 across second-order conditioning (right) for RG108- (n = 13), 5-AZA- (n = 12) and vehicle- (n = 27) treated rats. c, Percentage freezing to S1 across first-order conditioning (left) and S2 and S1 across second-order conditioning (right) for cycloheximide- (n = 12) and vehicle- (n = 10) treated rats. Drug-treated rats are shown with filled squares and circle and vehicle-treated rats are shown with open squares. Data are represented as mean ± SEM.