
Figure 5.
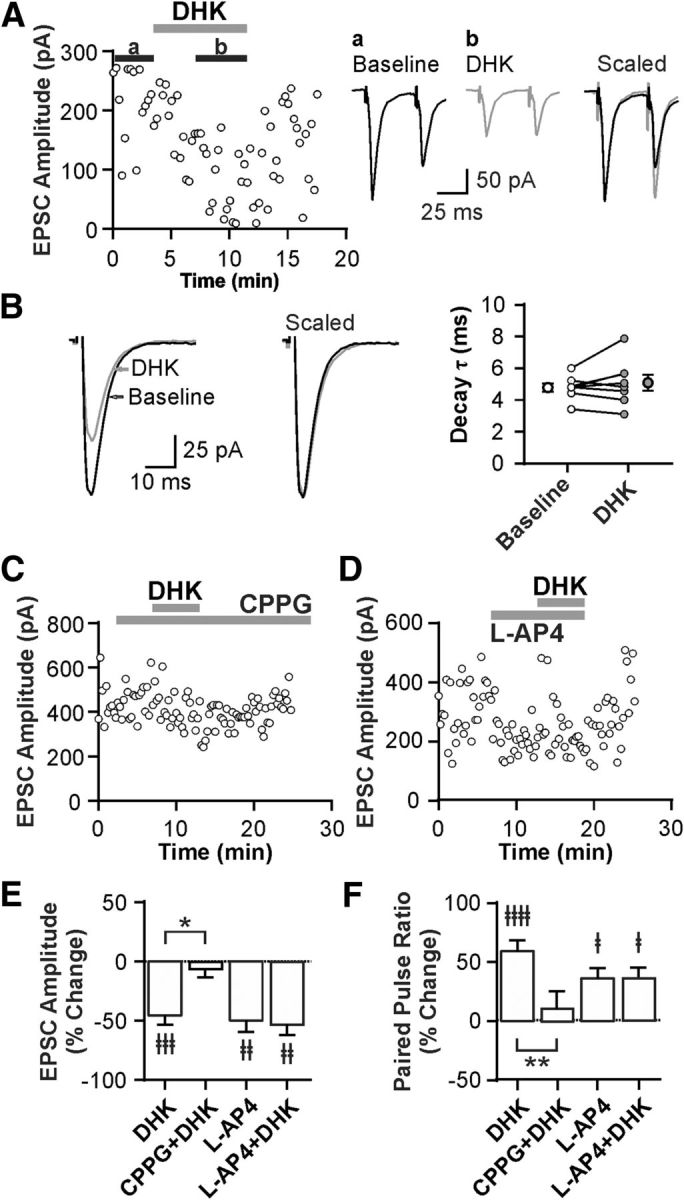
GLT1 prevents the activation of inhibitory presynaptic Group III mGluRs in glutamatergic synapses to ORX neurons in the Rest condition. A, Left, Representative time-effect plot showing the inhibitory effect of the GLT1 blocker DHK (100 μm) on EPSCs in an ORX neuron following Rest. Right, Averaged EPSC traces at baseline (a) and during DHK (b). Scaled and superimposed traces show that DHK changes PPR. Stimulus artifacts were truncated. B, DHK has no effect on the decay rate of EPSCs. Left, Representative EPSC recordings at baseline and during DHK. Right, Decay time constant τ. Open symbols connected with lines represent paired data from individual cells. Symbols with error bars indicate the mean and SEM of the group. C, Representative time-effect plot demonstrating that the Group III mGluR antagonist CPPG (200 μm) prevents the effect of DHK in an ORX neuron. D, Representative time-effect plot showing that the Group III mGluR agonist l-AP4 (50 μm) mimics and occludes the DHK effect in an ORX neuron. E, F, Summary bar graphs illustrating the changes in EPSC amplitude (E) and PPR (F) after different drug applications. ‡p < 0.05, compared with their respective baseline. ‡‡p < 0.01, compared with their respective baseline. ‡‡‡p < 0.001, compared with their respective baseline. ‡‡‡‡p < 0.0001, compared with their respective baseline. *p < 0.05, compared between groups. **p < 0.01, compared between groups.