Figure 6.
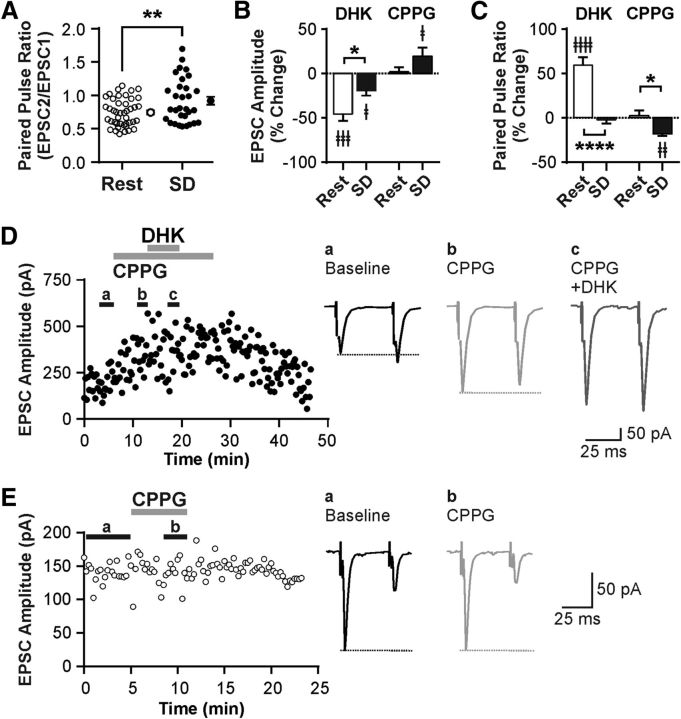
SD induces presynaptic inhibition at glutamatergic synapses to ORX neurons through GLT1 and Group III mGluRs. A, PPR in Rest and SD demonstrating that SD decreases release probability. Each symbol represents a cell. Symbols with error bars indicate the mean and SEM of the group. B, C, Effects of DHK and CPPG on EPSC amplitude (B) and PPR (C) by sleep condition. The effect of DHK on EPSC amplitude and PPR is attenuated or abolished in SD compared with Rest. In contrast, CPPG has no effect in Rest but increases EPSC amplitude while decreasing PPR in SD, indicating tonic presynaptic inhibition via Group III mGluRs specifically in SD. D, Left, Representative time-effect plot of EPSC amplitude of an ORX neuron after SD. Right, Averaged traces from baseline (a), in the presence of CPPG (b), and in the presence of CPPG plus DHK (c). Stimulus artifacts were truncated. Dashed lines starting at the first peak indicate the change in PPR. E, Left, Representative time-effect plot showing the lack of effect of CPPG on EPSCs in an ORX neuron in Rest. Right, Averaged traces from baseline (a) and with CPPG (b). Dashed lines starting at the first peak indicate no change in PPR. ‡p < 0.05, compared with their respective baseline. ‡‡p < 0.01, compared with their respective baseline. ‡‡‡p < 0.001, compared with their respective baseline. ‡‡‡‡p < 0.0001, compared with their respective baseline. *p < 0.05, Rest versus SD. **p < 0.01, Rest versus SD. ****p < 0.0001, Rest versus SD.

