
Figure 7.
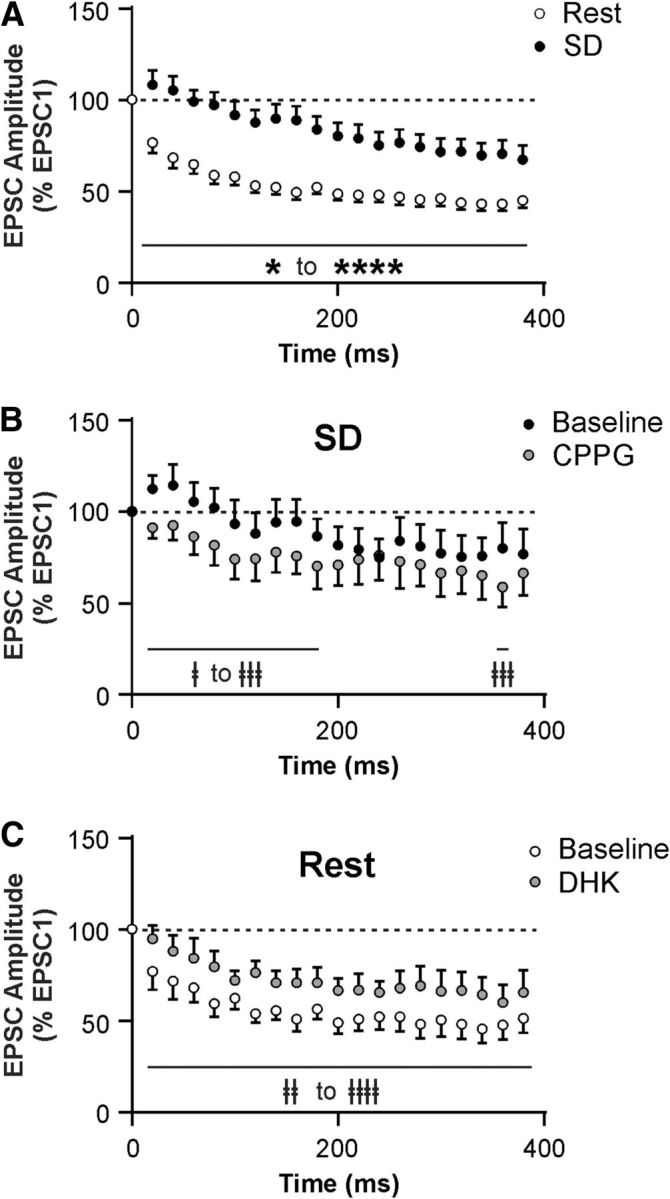
SD attenuates short-term synaptic depression in ORX neurons via GLT1 and Group III mGluRs. A, EPSC amplitude during a train stimulation (20 pulses at 50 Hz), normalized to the amplitude of the first EPSC (represented by the dashed line at 100%) after Rest or SD. Notice the attenuation in short-term synaptic depression following SD compared with Rest. B, CPPG (200 μm) partially reverses the attenuated synaptic depression induced by SD. C, DHK (10 μm) mimics the SD effect in ORX neurons after Rest. ‡p < 0.05, compared with their respective baseline. ‡‡p < 0.01, compared with their respective baseline. ‡‡‡p < 0.001, compared with their respective baseline. ‡‡‡‡p < 0.0001, compared with their respective baseline. *p < 0.05, Rest versus SD. ****p < 0.0001, Rest versus SD.