
Figure 8.
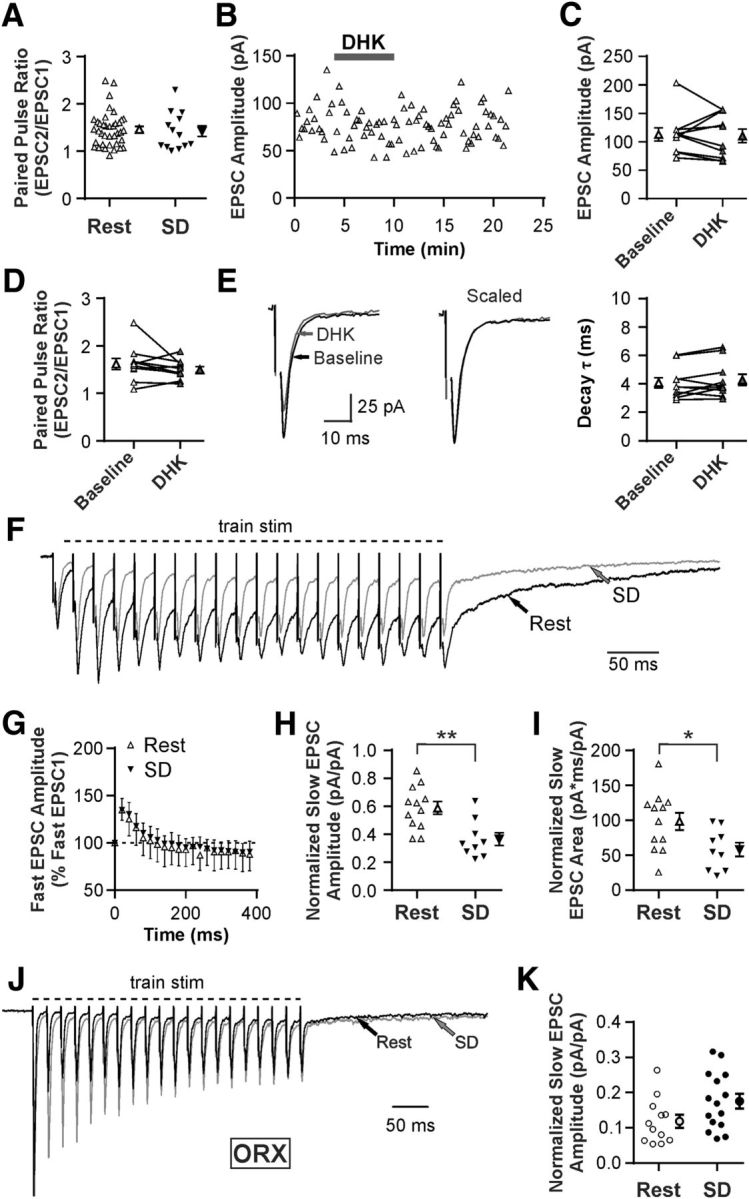
SD inhibits slow EPSC in MCH neurons independent of presynaptic mechanisms. A, PPR at excitatory synapses in MCH neurons by sleep state, demonstrating that SD has no effect on release probability. Each symbol represents a cell. Symbols with error bars indicate the mean and SEM for the group. B, C, Representative time-effect plot (B) and summary graph (C) showing lack of DHK effect (100 μm) on fast EPSC amplitude in MCH neurons in Rest. D, E, DHK has no effect on PPR (D) or the decay rate of EPSCs (E) in MCH neurons in Rest. Stimulus artifacts were truncated. F, Representative averaged traces from MCH neurons after Rest and SD (scaled to the first EPSC) showing fast EPSCs following each stimulus and a slow EPSC that persists after the end of train stimulation (20 pulses at 50 Hz). G, SD has no effect on fast EPSC amplitude. Responses are normalized to the amplitude of the first fast EPSC (represented by the dashed line at 100%). H, I, SD reduces the amplitude (H) and area (I) of the slow EPSC following train stimulation. Responses are normalized to the amplitude of the first fast EPSC to control for stimulus intensity across experiments. J, Representative averaged traces from ORX neurons after Rest and SD (scaled to the first EPSC) showing a slow EPSC that persists after the end of train stimulation (20 pulses at 50 Hz). K, SD has no effect on slow EPSC amplitude in ORX neurons. Responses normalized to the amplitude of the first fast EPSC. *p < 0.05. **p < 0.01.