Figure 7.
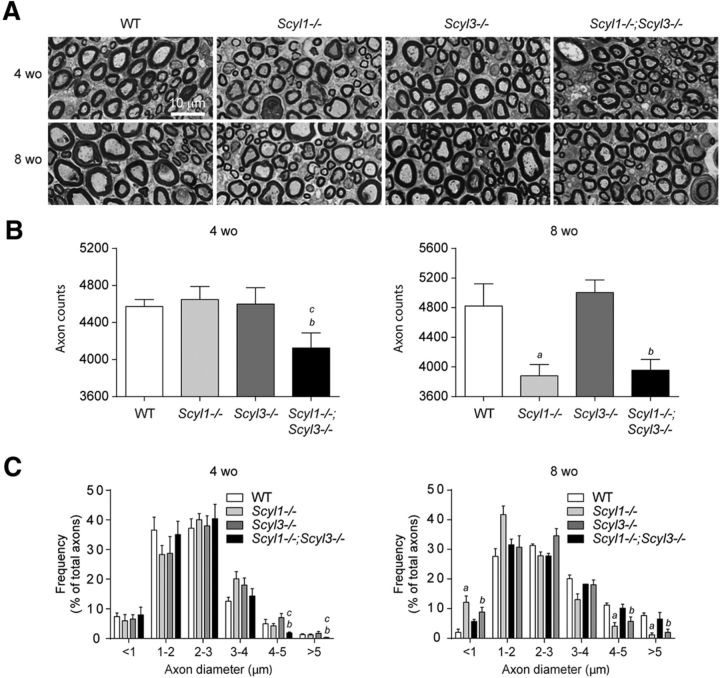
Loss of large-caliber axons in Scyl1−/− and Scyl1−/−;Scyl3−/− mice. A, Representative micrograph of toluidine blue-stained semithin sections of sciatic nerve from 4- and 8-week-old WT, Scyl1−/−, Scyl3−/−, and Scyl1−/−;Scyl3−/− mice. B, Myelinated axon counts in sciatic nerve of 4- and 8-week-old WT, Scyl1−/−, Scyl3−/−, and Scyl1−/−;Scyl3−/− mice (n = 3 for each age group and genotype). Data are expressed as mean ± SEM. P values, determined by the one-tailed Student's t test, are indicated on the graph. C, Histogram of the frequency of myelinated axons in sciatic nerves of 4- and 8-week-old WT, Scyl1−/−, Scyl3−/−, and Scyl1−/−;Scyl3−/− mice (n = 3 for each age group and genotype) as a function of axon diameter. Data are expressed as mean ± SEM. P values determined by two-tailed Student's t test. a, WT versus Scyl1−/−, p < 0.05; b, WT versus Scyl1−/−; Scyl3−/−, p < 0.05; c, Scyl1−/− versus Scyl1−/−;Scyl3−/−, p < 0.05.

